Liste der größten Agrarproduzenten
Die Liste der größten Agrarproduzenten gibt einen Überblick über die jeweils größten Produzenten verschiedener landwirtschaftlicher Güter zum letzten ermittelbaren Zeitpunkt. Es werden jeweils die fünf größten Produzenten angegeben sowie das gesamte weltweite Produktionsvolumen. Die Abstände zwischen den einzelnen Produzenten kommen dabei jedoch nicht zum Ausdruck. So sind z. B. nur zwei Länder für die Hälfte der weltweiten Reisproduktion verantwortlich: Indien und die Volksrepublik China.
Die landwirtschaftlichen Produktionsgüter sind in die Kategorien Getreide, Gemüse, Früchte, Milchprodukte, Getränke, Gewürze, Fleisch, Nüsse, Farben und Stoffe, Forstprodukte und sonstige eingeteilt. Alle Daten stammen von der Ernährungs- und Landwirtschaftsorganisation der Vereinten Nationen.
Landwirtschaftliche Produkte nach Produktionsvolumen
Am häufigsten produzierte landwirtschaftlichen Güter nach Produktionsvolumen in Tonnen (Stand 2017).
| Rang | Produkt | Kategorie | Weltproduktion in t |
|---|---|---|---|
| 1 | Zuckerrohr | Gemüse | 1.841.528.386 |
| 2 | Mais | Getreide | 1.134.746.667 |
| 3 | Weizen | Getreide | 771.718.579 |
| 4 | Reis | Getreide | 769.657.791 |
| 5 | Kuhmilch | Milchprodukt | 675.621.019 |
| 6 | Kartoffel | Gemüse | 388.190.674 |
| 7 | Sojabohne | Gemüse | 352.643.548 |
| 8 | Zuckerrübe | Gemüse | 301.015.696 |
| 9 | Maniok | Gemüse | 291.992.646 |
| 10 | Tomate | Früchte | 182.301.395 |
| 11 | Bier, Gerste* | Getränke | 180.332.523 |
| 12 | Zucker, roh* | Früchte | 147.404.262 |
| 13 | Gerste | Getreide | 147.404.262 |
| 14 | Büffelmilch | Milchprodukt | 120.353.705 |
| 15 | Schwein | Fleisch | 119.886.758 |
| 16 | Wassermelone | Früchte | 118.413.465 |
| 17 | Banane | Früchte | 113.918.763 |
| 18 | Süßkartoffel | Gemüse | 112.835.316 |
| 19 | Haushuhn | Fleisch | 109.056.179 |
| 20 | Zwiebel | Gemüse | 97.862.928 |
* Zahl von 2014
Länder nach Produktion (Lebensmittel)
Getreide
Alle Angaben beruhen auf Daten der FAOSTAT (Food and Agriculture Organization) der Vereinten Nationen (Stand 2017):[2]
| Getreide | 1. Produzent | 2. Produzent | 3. Produzent | 4. Produzent | 5. Produzent | Weltproduktion in t |
|---|---|---|---|---|---|---|
| Mais | 1.134.746.667 | |||||
| Weizen | 771.718.579 | |||||
| Reis | 769.657.791 | |||||
| Gerste | 147.404.262 | |||||
| Sorghum (Hirse) | 57.601.588 | |||||
| Millet (Hirse) | 28.459.020 | |||||
| Hafer | 25.949.161 | |||||
| Triticale | 15.563.415 | |||||
| Roggen | 13.733.945 | |||||
| Grüner Mais | 11.727.318 | |||||
Gemüse
Alle Angaben beruhen auf Daten der FAOSTAT (Food and Agriculture Organization) der Vereinten Nationen (Stand 2016):[2]
Früchte
Alle Angaben beruhen auf Daten der FAOSTAT (Food and Agriculture Organization) der Vereinten Nationen (Stand 2015–2016):[2]
Milchprodukte
Alle Angaben beruhen auf Daten der FAOSTAT (Food and Agriculture Organization) der Vereinten Nationen (Stand 2016):[3]
| Produkt | 1. Produzent | 2. Produzent | 3. Produzent | 4. Produzent | 5. Produzent | Weltproduktion in t |
|---|---|---|---|---|---|---|
| Kuhmilch | 636.585.973 | |||||
| Büffelmilch | 102.379.198 | |||||
| Ziegenmilch | 16.953.498 | |||||
| Schafmilch | 10.134.544 | |||||
| Kamelmilch | 2.827.743 | |||||
Getränke
Alle Angaben beruhen auf Daten der FAOSTAT (Food and Agriculture Organization) der Vereinten Nationen (Stand 2013):[4]
| Produkt | 1. Produzent | 2. Produzent | 3. Produzent | 4. Produzent | 5. Produzent | Weltproduktion in t |
|---|---|---|---|---|---|---|
| Milch (alle) | 803.426.346 | |||||
| Bier | 180.332.523 | |||||
| Wein | 29.105.841 | |||||
| Kaffee | 9.221.535 | |||||
| Tee | 5.954.091 | |||||
Fleisch
Alle Angaben beruhen auf Daten der FAOSTAT (Food and Agriculture Organization) der Vereinten Nationen (Stand 2013):[5]
| Fleisch | 1. Produzent | 2. Produzent | 3. Produzent | 4. Produzent | 5. Produzent | Weltproduktion in t |
|---|---|---|---|---|---|---|
| Schwein | 112.333.009 | |||||
| Huhn | 97.600.396 | |||||
| Rind | 68.445.478 | |||||
| Schaf | 8.213.621 | |||||
| Truthahn | 5.651.405 | |||||
| Ziege | 5.211.336 | |||||
| Ente | 4.367.273 | |||||
| Gans | 2.698.322 | |||||
| Kaninchen | 1.339.793 | |||||
| Pferd | 785.185 | |||||
Nüsse
Alle Angaben beruhen auf Daten der FAOSTAT (Food and Agriculture Organization) der Vereinten Nationen (Stand 2016):[2]
| Nuss | 1. Produzent | 2. Produzent | 3. Produzent | 4. Produzent | 5. Produzent | Weltproduktion in t |
|---|---|---|---|---|---|---|
| Erdnuss | 43.982.063 | |||||
| Cashew | 4.898.210 | |||||
| Walnuss | 3.747.549 | |||||
| Mandel | 3.214.303 | |||||
| Kastanien | 2.261.589 | |||||
| Pistazie | 1.057.566 | |||||
| Haselnuss | 743.455 | |||||
| Karité | k. A. | k. A. | k. A. | |||
Gewürze
Alle Angaben beruhen auf Daten der FAOSTAT (Food and Agriculture Organization) der Vereinten Nationen (Stand 2016):[2]
| Gewürz | 1. Produzent | 2. Produzent | 3. Produzent | 4. Produzent | 5. Produzent | Weltproduktion in t |
|---|---|---|---|---|---|---|
| Chili und Grüner Pfeffer | 34.497.462 | |||||
| Knoblauch | 26.573.001 | |||||
| Ingwer | 3.270.762 | |||||
| Anis, Fenchel und Koriander |
1.185.380 | |||||
| Senf | 699.038 | |||||
| Schwarzer Pfeffer | 546.259 | |||||
| Zimt | 223.574 | |||||
| Gewürznelken | 180.520 | |||||
| Muskatnuss | 122.151 | |||||
| Pfefferminze | 106.252 | |||||
| Vanille | 7.940 | |||||
| Safran | 473 | |||||
Sonstige
Alle Angaben beruhen auf Daten der FAOSTAT (Food and Agriculture Organization) der Vereinten Nationen (Stand 2016).[6]
| Produkt | 1. Produzent | 2. Produzent | 3. Produzent | 4. Produzent | 5. Produzent | Weltproduktion in t |
|---|---|---|---|---|---|---|
| Eier | 73.889.906 | |||||
| Pilze und Trüffel | 10.790.859 | |||||
| Tabak | 6.664.238 | |||||
| Kakaobohnen | 4.466.574 | |||||
| Honig | 1.786.996 | |||||
Länder nach Produktion (Nicht-Lebensmittel)
Fasern und Stoffe
Alle Angaben beruhen auf Daten der FAOSTAT (Food and Agriculture Organization) der Vereinten Nationen (Stand 2013):[7][8]
| Fiber | 1. Produzent | 2. Produzent | 3. Produzent | 4. Produzent | 5. Produzent |
|---|---|---|---|---|---|
| Abaca (Manilahanf) | |||||
| Agaven | |||||
| Baumwolle | |||||
| Lein | |||||
| Jute | |||||
| Kapok (2012) | k. A. | k. A. | k. A. | ||
| Ramie | k. A. | ||||
| Gummi | |||||
| Seide | |||||
| Sisal-Agave | |||||
| Wolle | |||||
Forstprodukte
Alle Angaben beruhen auf Daten der FAOSTAT (Food and Agriculture Organization) der Vereinten Nationen (Stand 2013):[9]
| Fortstprodukt | 1. Produzent | 2. Produzent | 3. Produzent | 4. Produzent | 5. Produzent |
|---|---|---|---|---|---|
| Brennholz | |||||
| Schnittholz | |||||
| Holzplatten | |||||
| Papier und Pappe | |||||
| Auflösender Zellstoff | |||||
Karten
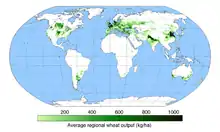 Weizenproduktion weltweit
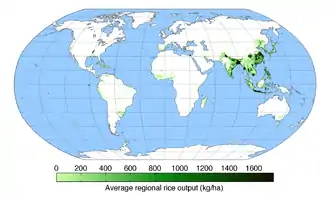 Reisproduktion weltweit
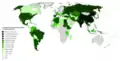 Länder nach Knoblauchproduktion
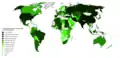 Länder nach Zwiebelproduktion
 Länder nach Kartoffelproduktion
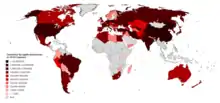 Länder nach Apfelproduktion
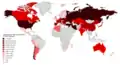 Länder nach Kirschproduktion
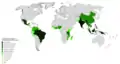 Länder nach Kokosnussproduktion
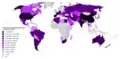 Länder nach Weintraubenproduktion
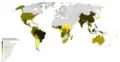 Länder nach Ananasproduktion
 Länder nach Birnenproduktion
 Länder nach Pflaumenproduktion
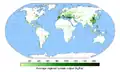 Tomatenproduktion weltweit
Siehe auch
Einzelnachweise
- Crops, Crops processed und Livestock Primary. In: Produktionsstatistik der FAO für 2017. fao.org, abgerufen am 4. März 2019 (englisch).
- Crops. In: Produktionsstatistik der FAO für 2017. fao.org, abgerufen am 4. März 2019 (englisch).
- Data > Livestock Processed. Produktionsstatistik für tierische Produkte, 2016. Abgerufen am 24. Juli 2017.
- FAOSTAT (englisch) FAO. Abgerufen am 26. Juli 2019.
- http://faostat3.fao.org/browse/rankings/countries_by_commodity/E
- http://faostat3.fao.org/browse/Q/QL/E