Kanton Saint-Nicolas-de-Port
Der Kanton Saint-Nicolas-de-Port war bis 2015 ein französischer Wahlkreis im Arrondissement Nancy im Département Meurthe-et-Moselle. Letzter Vertreter im Generalrat des Départements war von 2004 bis 2015 Jean-Claude Pissenem (PS). Hauptort des Kantons war die Gemeinde Saint-Nicolas-de-Port. Der Kanton hatte (1999) 26.512 Einwohner auf einer Fläche von 132,52 km².
| Ehemaliger Kanton Saint-Nicolas-de-Port | |
|---|---|
| Region | Lothringen |
| Département | Meurthe-et-Moselle |
| Arrondissement | Nancy |
| Hauptort | Saint-Nicolas-de-Port |
| Auflösungsdatum | 29. März 2015 |
| Einwohner | 27.733 (1. Jan. 2012) |
| Bevölkerungsdichte | 209 Einw./km² |
| Fläche | 132.52 km² |
| Gemeinden | 14 |
| INSEE-Code | 5425 |
Lage
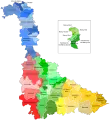
Der Kanton lag im Zentrum der Südhälfte des Départements Meurthe-et-Moselle.
 Kantone im Département Meurthe-et-Moselle
 Lage des Kantons Saint-Nicolas-de-Port im Arrondissement Nancy
Gemeinden
Der Kanton umfasste 14 Gemeinden:
| Gemeinde | Einwohner Jahr | Fläche km² | Bevölkerungsdichte | Code INSEE | Postleitzahl |
|---|---|---|---|---|---|
| Azelot | 421 (2013) | 4,75 | 89 Einw./km² | 54037 | 54210 |
| Burthecourt-aux-Chênes | 100 (2013) | 5,59 | 18 Einw./km² | 54108 | 54210 |
| Coyviller | 144 (2013) | 4,53 | 32 Einw./km² | 54141 | 54210 |
| Dombasle-sur-Meurthe | 9.953 (2013) | 11,21 | 888 Einw./km² | 54159 | 54110 |
| Ferrières | 299 (2013) | 6,25 | 48 Einw./km² | 54192 | 54210 |
| Flavigny-sur-Moselle | 1.733 (2013) | 17,3 | 100 Einw./km² | 54196 | 54630 |
| Lupcourt | 437 (2013) | 6,94 | 63 Einw./km² | 54330 | 54210 |
| Manoncourt-en-Vermois | 334 (2013) | 6,68 | 50 Einw./km² | 54345 | 54210 |
| Richardménil | 2.396 (2013) | 7,17 | 334 Einw./km² | 54459 | 54630 |
| Rosières-aux-Salines | 2.873 (2013) | 26,95 | 107 Einw./km² | 54462 | 54110 |
| Saffais | 126 (2013) | 4,04 | 31 Einw./km² | 54468 | 54210 |
| Saint-Nicolas-de-Port | 7.602 (2013) | 8,23 | 924 Einw./km² | 54483 | 54210 |
| Tonnoy | 735 (2013) | 12,35 | 60 Einw./km² | 54527 | 54210 |
| Ville-en-Vermois | 593 (2013) | 10,53 | 56 Einw./km² | 54571 | 54210 |
Bevölkerungsentwicklung
| 1962 | 1968 | 1975 | 1982 | 1990 | 1999 | 2006 | 2012 |
|---|---|---|---|---|---|---|---|
| 20.630 | 22.652 | 24.267 | 26.371 | 27.100 | 26.512 | 27.422 | 27.733 |
This article is issued from Wikipedia. The text is licensed under Creative Commons - Attribution - Sharealike. The authors of the article are listed here. Additional terms may apply for the media files, click on images to show image meta data.