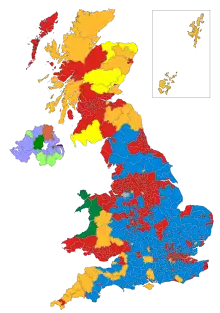
Britische Unterhauswahl 1997
Die britische Unterhauswahl 1997 vom 1. Mai 1997 brachte den ersten Regierungswechsel seit 18 Jahren. Die Labour Party unter Tony Blair schlug die bislang regierende Conservative Party unter John Major. Diese Wahl wurde als „Blutbad“ (bloodbath) für die Konservativen bezeichnet. Sie verloren mehr als die Hälfte der bisherigen Mandate, darunter sämtliche in Schottland und Wales. Labour konnte die größte Mehrheit für eine Partei in der Geschichte Großbritanniens erringen (179).
Verschiedene prominente Konservative, darunter mehrere Kabinettsmitglieder, wurden abgewählt. Zu diesen zählten Verteidigungsminister Michael Portillo, Außenminister Malcolm Rifkind, Handels- und Industrieminister Ian Lang und Schottlandminister Michael Forsyth.
Die Liberal Democrats konnten die Anzahl ihre Mandate mehr als verdoppeln und erreichten das beste Resultat seit den 1920ern, als sie letztmals in der Regierung vertreten waren. Die Referendum Party, die eine Abstimmung für den Austritt aus der EU verlangte, erreichte zwar mit mehr als 800.000 Stimmen den vierten Platz, konnte aber keine Sitze gewinnen. Dennoch nahm sie den Konservativen wertvolle Stimmen weg.
Wahlergebnisse

| Partei | Stimmen | Mandate | ||||
|---|---|---|---|---|---|---|
| Anzahl | % | +/− | Anzahl | +/− | ||
| Labour Party | 13.517.911 | 43,2 | +8,8 | 418 | +147 | |
| Conservative Party | 9.600.940 | 30,7 | −11,2 | 165 | −171 | |
| Liberal Democrats | 5.243.440 | 16,8 | −1,0 | 46 | +26 | |
| Referendum Party | 811.829 | 2,6 | +2,6 | − | − | |
| Scottish National Party | 622.260 | 2,0 | +0,1 | 6 | +3 | |
| Ulster Unionist Party | 258.349 | 0,8 | − | 10 | +1 | |
| Social Democratic and Labour Party | 190.814 | 0,6 | +0,1 | 3 | −1 | |
| Plaid Cymru | 161.030 | 0,5 | – | 4 | – | |
| Sinn Féin | 127.144 | 0,4 | +0,2 | 2 | +2 | |
| Democratic Unionist Party | 107.348 | 0,3 | – | 2 | −1 | |
| UK Independence Party | 106.001 | 0,3 | +0,3 | – | – | |
| Unabhängige | 64.482 | 0,2 | – | 1 | – | |
| Green Party of England and Wales | 64.452 | 0,2 | −0,3 | – | – | |
| Alliance Party of Northern Ireland | 62.972 | 0,2 | – | – | – | |
| Socialist Labour Party | 52.110 | 0,2 | +0,2 | – | – | |
| Liberal Party | 45.229 | 0,1 | −0,1 | – | – | |
| British National Party | 35.519 | 0,1 | +0,1 | – | – | |
| Independent Labour | 34.418 | 0,1 | − | − | − | |
| Natural Law Party | 30.713 | 0,1 | −0,1 | – | – | |
| Speaker | 23.969 | 0,1 | – | 1 | – | |
| Independent Conservative | 20.279 | 0,1 | − | − | − | |
| Prolife Alliance | 19.017 | 0,1 | +0,1 | – | – | |
| UK Unionist Party | 12.817 | 0,0 | – | 1 | +1 | |
| Progressive Unionist Party | 10.934 | 0,0 | – | – | – | |
| National Democrats | 10.829 | 0,0 | – | – | – | |
| Sonstige | 53.302 | 0,3 | − | − | − | |
| Gesamt | 31.288.108 | 100,0 | 659 | |||
| Wahlberechtigte | 43.784.559 | |||||
| Wahlbeteiligung | 71,46 % | |||||
| Quelle:[1] | ||||||
Einzelnachweise
- Summary results of the 1997 election. United Kingdom Election Results (englisch)