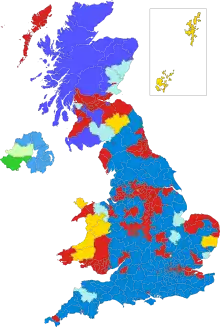
Britische Unterhauswahl 1950
Die Britische Unterhauswahl 1950 vom 23. Februar 1950 war die erste Wahl nach einer Legislaturperiode unter Führung der Labour-Partei.
Gewinne und Verluste

Wahlkreisergebnisse
Bedeutende Änderung gegenüber den Unterhauswahlen von 1945 war die 1948 erfolgte Abschaffung der 12 Universitäts-Wahlkreise sowie des Mehrfachstimmrechts für Land- und Geschäftseigentümer (property owners), die bis dahin sowohl an ihrem Wohnort als auch am Ort ihres Besitztums wählen durften.
Die Wahl ergab für Labour eine hauchdünne Mehrheit von 5 Sitzen. Daraufhin rief die Partei Neuwahlen für das Jahr 1951 aus.
Wahlergebnisse
| Partei | Stimmen | Sitze | ||||
|---|---|---|---|---|---|---|
| Anzahl | % | +/− | Anzahl | +/− | ||
| Labour Party | 13.266.176 | 46,1 | −3,6 | 315 | −78 | |
| Conservative Party | 11.507.061 | 40,0 | +3,8 | 282 | +85 | |
| Liberal Party | 2.621.487 | 9,1 | +0,1 | 9 | −3 | |
| National Liberal Party | 985.343 | 3,4 | +0,5 | 16 | +5 | |
| Communist Party of Great Britain | 91.765 | 0,3 | −0,1 | − | −2 | |
| Nationalist Party (Northern Ireland) | 65.211 | 0,2 | −0,2 | 2 | − | |
| Irish Labour Party | 52.715 | 0,2 | +0,2 | − | − | |
| Unabhängige | 50.299 | 0,2 | − | − | − | |
| Independent Labour | 26.395 | 0,1 | − | − | − | |
| Independent Conservative | 24.732 | 0,1 | − | − | − | |
| Sinn Féin | 23.362 | 0,1 | +0,1 | − | − | |
| Plaid Cymru | 17.580 | 0,1 | − | − | − | |
| Independent Liberal | 15.066 | 0,1 | − | 1 | − | |
| Scottish National Party | 9.708 | 0,0 | −0,1 | − | − | |
| Sonstige | 14.224 | 0,0 | − | − | − | |
| Gesamt | 28.771.124 | 100,0 | 625 | |||
| Wahlberechtigte | 34.412.255 | |||||
| Wahlbeteiligung | 83,9 % | |||||
| Quelle:[1] | ||||||
Siehe auch
Einzelnachweise
- General Election Results 1885–1979 United Kingdom Election Results (Englisch)
This article is issued from Wikipedia. The text is licensed under Creative Commons - Attribution - Sharealike. The authors of the article are listed here. Additional terms may apply for the media files, click on images to show image meta data.