Britische Unterhauswahl 1959
Die britische Unterhauswahl 1959 fand am 8. Oktober 1959 statt. Bei der Wahl wurden die Abgeordneten für das Unterhaus (House of Commons) neu bestimmt.
Wahlsystem
Gewählt wurde nach dem einfachen Mehrheitswahlsystem. Eine Sperrklausel gab es nicht.
Wahlergebnis
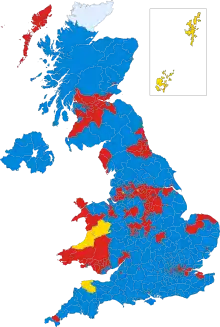
Die Conservative Party fuhr mit 46,6 Prozent ein nahezu identisches Ergebnis im Vergleich zur vorigen Unterhauswahl von 1955 ein. Damit konnte sie ihre absolute Mehrheit verteidigen. Die Labour Party musste deutliche Verluste hinnehmen. Die meisten Stimmen hinzugewinnen konnte die Liberal Party.
| Partei | Stimmen | Sitze | ||||
|---|---|---|---|---|---|---|
| Anzahl | % | +/− | Anzahl | +/− | ||
| Conservative Party | 12.985.081 | 46,6 | − | 345 | +21 | |
| Labour Party | 12.216.172 | 43,9 | −2,5 | 258 | −19 | |
| Liberal Party | 1.640.760 | 5,9 | +3,2 | 6 | − | |
| National Liberal Party | 765.794 | 2,7 | −0,4 | 20 | −1 | |
| Plaid Cymru | 77.571 | 0,3 | +0,1 | − | − | |
| Sinn Féin | 63.415 | 0,2 | −0,4 | − | −2 | |
| Communist Party of Great Britain | 30.896 | 0,1 | − | − | − | |
| Scottish National Party | 21.738 | 0,1 | +0,1 | − | − | |
| Independent Labour Group | 20.062 | 0,1 | − | − | − | |
| Independent Conservative | 14.118 | 0,0 | − | 1 | − | |
| Sonstige | 27.045 | 0,1 | − | − | − | |
| Gesamt | 27.862.652 | 100,0 | 630 | |||
| Wahlberechtigte | 35.397.304 | |||||
| Wahlbeteiligung | 78,7 % | |||||
| Quelle:[1] | ||||||
Einzelnachweise
- General Election Results 1885–1979 United Kingdom Election Results (englisch)
| Unterhauswahlen |
1832 • 1835 • 1837 • 1841 • 1847 • 1852 • 1857 • 1859 • 1865 • 1868 • 1874 • 1880 • 1885 • 1886 • 1892 • 1895 • 1900 • 1906 • 1910 (Jan) • 1910 (Dez) • 1918 • 1922 • 1923 • 1924 • 1929 • 1931 • 1935 • 1945 • 1950 • 1951 • 1955 • 1959 • 1964 • 1966 • 1970 • 1974 (Feb) • 1974 (Okt) • 1979 • 1983 • 1987 • 1992 • 1997 • 2001 • 2005 • 2010 • 2015 • 2017 • 2019 |
|
| Europawahlen |
1979 • 1984 • 1989 • 1994 • 1999 • 2004 • 2009 • 2014 • 2019 | |
| Referenden |
EWG-Mitgliedschaft 1975 • Wahlrechtsreferendum 2011 • EU-Mitgliedschaft 2016 |