Britische Unterhauswahl 1983
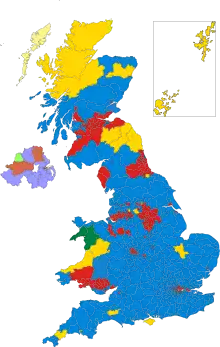
Die britische Unterhauswahl 1983 fand am 9. Juni 1983 statt. Es wurde der größte Wahlerfolg der Conservative Party unter Margaret Thatcher bzw. einer Partei seit der von Labour gewonnenen Unterhauswahl 1945.
Die Oppositionsparteien SDP/Liberal Alliance und Labour erhielten fast die gleiche Anzahl an Stimmen. Seit 1918 war dies die größte Wahlniederlage der Labour-Partei, die über 3 Millionen Stimmen gegenüber 1979 verlor und den Konservativen eine Mehrheit von 144 Sitzen brachte, obwohl diese ebenfalls leichte Stimmenverluste hinnehmen musste.
Die SDP-Liberal Alliance lag nur 675.985 Stimmen hinter Labour, erhielt aber auf Grund des relativen Mehrheitswahlrechtes 186 Sitze weniger.
.jpg.webp)
Ergebnisse
| Partei | Stimmen | Mandate | ||||
|---|---|---|---|---|---|---|
| Anzahl | % | +/− | Anzahl | +/− | ||
| Conservative Party | 13.012.316 | 42,4 | −1,5 | 397 | +58 | |
| Labour Party | 8.456.934 | 27,6 | −9,3 | 209 | −60 | |
| SDP–Liberal Alliance | 7.780.949 | 25,4 | +11,6 | 23 | +12 | |
| Scottish National Party | 331.975 | 1,1 | −0,5 | 2 | − | |
| Ulster Unionist Party | 259.952 | 0,8 | − | 11 | +5 | |
| Democratic Unionist Party | 152.749 | 0,5 | +0,3 | 3 | − | |
| Social Democratic and Labour Party | 137.012 | 0,4 | − | 1 | − | |
| Plaid Cymru | 125.309 | 0,4 | − | 2 | − | |
| Sinn Féin | 102.701 | 0,3 | +0,3 | 1 | +1 | |
| Alliance Party of Northern Ireland | 61.275 | 0,2 | −0,1 | − | − | |
| Ecology Party | 52.507 | 0,2 | +0,1 | − | − | |
| British National Front | 27.065 | 0,1 | −0,5 | − | − | |
| Unabhängige | 26.031 | 0,1 | − | − | − | |
| Ulster Popular Unionist Party | 22.861 | 0,1 | − | 1 | +1 | |
| Independent Labour | 17.151 | 0,1 | − | − | − | |
| Independent Conservative | 16.657 | 0,1 | − | − | − | |
| Workers’ Party of Ireland | 14.650 | 0,0 | −0,1 | − | − | |
| British National Party | 14.621 | 0,0 | − | − | − | |
| Independent Liberal | 13.632 | 0,0 | − | − | − | |
| Communist Party of Great Britain | 11.606 | 0,0 | −0,1 | − | − | |
| Independent Socialist | 10.414 | 0,0 | − | − | − | |
| Workers Revolutionary Party | 3.798 | 0,0 | −0,1 | − | − | |
| Official Monster Raving Loony Party | 3.524 | 0,0 | − | − | − | |
| Wessex Regionalist Party | 1.750 | 0,0 | − | − | − | |
| Sonstige | 13.698 | 0,0 | − | − | − | |
| Gesamt | 30.671.137 | 100,0 | 650 | |||
| Wahlberechtigte | 42.192.999 | |||||
| Wahlbeteiligung | 72,69 % | |||||
| Quelle:[1] | ||||||
Einzelnachweise
- Summary results of the 1983 election United Kingdom Election Results (englisch)
| Unterhauswahlen |
1832 • 1835 • 1837 • 1841 • 1847 • 1852 • 1857 • 1859 • 1865 • 1868 • 1874 • 1880 • 1885 • 1886 • 1892 • 1895 • 1900 • 1906 • 1910 (Jan) • 1910 (Dez) • 1918 • 1922 • 1923 • 1924 • 1929 • 1931 • 1935 • 1945 • 1950 • 1951 • 1955 • 1959 • 1964 • 1966 • 1970 • 1974 (Feb) • 1974 (Okt) • 1979 • 1983 • 1987 • 1992 • 1997 • 2001 • 2005 • 2010 • 2015 • 2017 • 2019 |
|
| Europawahlen |
1979 • 1984 • 1989 • 1994 • 1999 • 2004 • 2009 • 2014 • 2019 | |
| Referenden |
EWG-Mitgliedschaft 1975 • Wahlrechtsreferendum 2011 • EU-Mitgliedschaft 2016 |