Kanton Gournay-en-Bray
Der Kanton Gournay-en-Bray ist ein französischer Wahlkreis im Arrondissement Dieppe im Département Seine-Maritime in der Region Normandie; sein Hauptort ist Gournay-en-Bray, Vertreter im Generalrat des Départements war von 1987 bis 2011 Alain Carment (PS, später DVG). Ihm folgte Florence Legendre (ebenfalls DVG) nach.
| Kanton Gournay-en-Bray | |
|---|---|
| Region | Normandie |
| Département | Seine-Maritime |
| Arrondissement | Dieppe |
| Hauptort | Gournay-en-Bray |
| Einwohner | 35.859 (1. Jan. 2019) |
| Bevölkerungsdichte | 45 Einw./km² |
| Fläche | 793,85 km² |
| Gemeinden | 67 |
| INSEE-Code | 7612 |
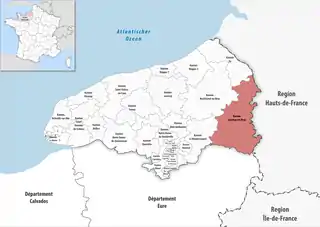 Lage des Kantons Gournay-en-Bray im Département Seine-Maritime | |
Gemeinden
Der Kanton besteht aus 67 Gemeinden mit insgesamt 35.859 Einwohnern (Stand: 1. Januar 2019) auf einer Gesamtfläche von 793,85 km²:
| Gemeinde | Einwohner 1. Januar 2019 |
Fläche km² |
Dichte Einw./km² |
Code INSEE |
Postleitzahl |
|---|---|---|---|---|---|
| Argueil | 344 | 7,07 | 49 | 76025 | 76780 |
| Aubéguimont | 187 | 4,88 | 38 | 76028 | 76390 |
| Aumale | 1.986 | 9,00 | 221 | 76035 | 76390 |
| Avesnes-en-Bray | 297 | 11,94 | 25 | 76048 | 76220 |
| Beaubec-la-Rosière | 497 | 13,07 | 38 | 76060 | 76440 |
| Beaussault | 411 | 18,48 | 22 | 76065 | 76870 |
| Beauvoir-en-Lyons | 604 | 33,86 | 18 | 76067 | 76220 |
| Bézancourt | 357 | 17,71 | 20 | 76093 | 76220 |
| Bosc-Hyons | 434 | 5,60 | 78 | 76124 | 76220 |
| Brémontier-Merval | 454 | 17,21 | 26 | 76142 | 76220 |
| Compainville | 166 | 6,47 | 26 | 76185 | 76440 |
| Conteville | 496 | 13,82 | 36 | 76186 | 76390 |
| Criquiers | 691 | 22,75 | 30 | 76199 | 76390 |
| Croisy-sur-Andelle | 534 | 3,76 | 142 | 76201 | 76780 |
| Cuy-Saint-Fiacre | 665 | 9,70 | 69 | 76208 | 76220 |
| Dampierre-en-Bray | 442 | 12,93 | 34 | 76209 | 76220 |
| Doudeauville | 98 | 4,00 | 25 | 76218 | 76220 |
| Elbeuf-en-Bray | 406 | 10,90 | 37 | 76229 | 76220 |
| Ellecourt | 151 | 4,48 | 34 | 76233 | 76390 |
| Ernemont-la-Villette | 195 | 7,55 | 26 | 76242 | 76220 |
| Ferrières-en-Bray | 1.675 | 15,94 | 105 | 76260 | 76220 |
| Forges-les-Eaux | 3.812 | 15,50 | 246 | 76276 | 76440 |
| Fry | 144 | 7,95 | 18 | 76292 | 76780 |
| Gaillefontaine | 1.224 | 26,48 | 46 | 76295 | 76870 |
| Gancourt-Saint-Étienne | 230 | 12,65 | 18 | 76297 | 76220 |
| Gournay-en-Bray | 6.041 | 10,35 | 584 | 76312 | 76220 |
| Grumesnil | 423 | 11,30 | 37 | 76332 | 76440 |
| Haucourt | 193 | 10,25 | 19 | 76343 | 76440 |
| Haudricourt | 407 | 29,94 | 14 | 76344 | 76390 |
| Haussez | 281 | 13,24 | 21 | 76345 | 76440 |
| Hodeng-Hodenger | 272 | 11,57 | 24 | 76364 | 76780 |
| Illois | 410 | 14,69 | 28 | 76372 | 76390 |
| La Bellière | 54 | 4,57 | 12 | 76074 | 76440 |
| La Chapelle-Saint-Ouen | 135 | 7,87 | 17 | 76171 | 76780 |
| La Ferté-Saint-Samson | 458 | 19,15 | 24 | 76261 | 76440 |
| La Feuillie | 1.289 | 39,87 | 32 | 76263 | 76220 |
| La Hallotière | 224 | 3,73 | 60 | 76338 | 76780 |
| La Haye | 372 | 6,79 | 55 | 76352 | 76780 |
| Landes-Vieilles-et-Neuves | 131 | 7,16 | 18 | 76381 | 76390 |
| Le Caule-Sainte-Beuve | 482 | 16,81 | 29 | 76166 | 76390 |
| Le Héron | 247 | 10,83 | 23 | 76358 | 76780 |
| Le Mesnil-Lieubray | 97 | 5,84 | 17 | 76431 | 76780 |
| Le Thil-Riberpré | 230 | 10,12 | 23 | 76691 | 76440 |
| Longmesnil | 49 | 4,00 | 12 | 76393 | 76440 |
| Marques | 233 | 13,25 | 18 | 76411 | 76390 |
| Mauquenchy | 358 | 12,74 | 28 | 76420 | 76440 |
| Ménerval | 168 | 12,68 | 13 | 76423 | 76220 |
| Mésangueville | 161 | 10,69 | 15 | 76426 | 76780 |
| Mesnil-Mauger | 245 | 8,38 | 29 | 76432 | 76440 |
| Molagnies | 197 | 4,66 | 42 | 76440 | 76220 |
| Montroty | 271 | 10,83 | 25 | 76450 | 76220 |
| Saint-Lucien | 233 | 9,09 | 26 | 76601 | 76780 |
| Morienne | 188 | 9,02 | 21 | 76606 | 76390 |
| Morville-sur-Andelle | 316 | 5,18 | 61 | 76455 | 76780 |
| Neuf-Marché | 667 | 17,94 | 37 | 76463 | 76220 |
| Nolléval | 432 | 9,96 | 43 | 76469 | 76780 |
| Nullemont | 132 | 5,78 | 23 | 76479 | 76390 |
| Pommereux | 95 | 5,32 | 18 | 76505 | 76440 |
| Richemont | 441 | 10,75 | 41 | 76527 | 76390 |
| Roncherolles-en-Bray | 461 | 14,54 | 32 | 76535 | 76440 |
| Ronchois | 184 | 8,74 | 21 | 76537 | 76390 |
| Rouvray-Catillon | 225 | 12,38 | 18 | 76544 | 76440 |
| Saint-Michel-d’Halescourt | 118 | 4,96 | 24 | 76623 | 76440 |
| Saumont-la-Poterie | 411 | 16,14 | 25 | 76666 | 76440 |
| Serqueux | 979 | 5,75 | 170 | 76672 | 76440 |
| Sigy-en-Bray | 496 | 18,35 | 27 | 76676 | 76780 |
| Vieux-Rouen-sur-Bresle | 553 | 14,94 | 37 | 76739 | 76390 |
| Kanton Gournay-en-Bray | 35.859 | 793,85 | 45 | 7612 | – |
Bis zur Neuordnung bestand der Kanton Gournay-en-Bray aus den 16 Gemeinden Avesnes-en-Bray, Bézancourt, Bosc-Hyons, Brémontier-Merval, Cuy-Saint-Fiacre, Dampierre-en-Bray, Doudeauville, Elbeuf-en-Bray, Ernemont-la-Villette, Ferrières-en-Bray, Gancourt-Saint-Étienne, Gournay-en-Bray, Ménerval, Molagnies, Montroty und Neuf-Marché. Sein Zuschnitt entsprach einer Fläche von 181,13 km2.
Veränderungen im Gemeindebestand seit der landesweiten Neuordnung der Kantone
2017: Abspaltung von Sigy-en-Bray → Saint-Lucien
2016: Fusion Forges-les-Eaux und Le Fossé → Forges-les-Eaux
Bevölkerungsentwicklung
| 1962 | 1968 | 1975 | 1982 | 1990 | 1999 | 2010 |
|---|---|---|---|---|---|---|
| 9.708 | 10.909 | 11.350 | 11.273 | 11.490 | 11.952 | 12.911 |