Kanadische Unterhauswahl 1949
Die 21. kanadische Unterhauswahl (englisch 21st Canadian General Election, französisch 21e élection fédérale canadienne) fand am 27. Juni 1949 statt. Gewählt wurden 262 Abgeordnete des kanadischen Unterhauses (engl. House of Commons, frz. Chambre des Communes).
Die Wahl
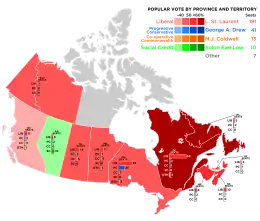
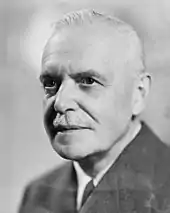
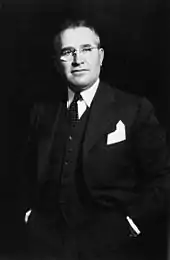
Es war die erste Wahl in Kanada seit fast dreißig Jahren, bei denen die Liberale Partei nicht von William Lyon Mackenzie King angeführt wurde. King war im Jahr zuvor zurückgetreten und durch Louis Saint-Laurent als Premierminister und Parteivorsitzender ersetzt worden. Saint-Laurent führte seine Partei zum vierten Wahlsieg in Folge; die Liberalen erzielten fast 50 % der Stimmen und sicherten sich eine überwältigende Mehrheit der Sitze.
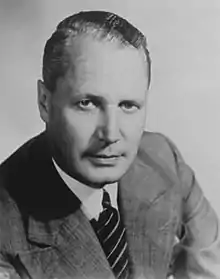
Die Progressiv-konservative Partei trat mit George Alexander Drew, dem ehemaligen Premierminister der Provinz Ontario, als neuen Vorsitzenden an. Doch es gelang ihr nicht, außerhalb ihrer Hochburg Ontario nennenswerte Erfolge zu erzielen und musste sogar Verluste hinnehmen. Die übrigen Parteien, darunter die Co-operative Commonwealth Federation und die Social Credit Party, erzielten ebenfalls ein schlechteres Ergebnis.
Erstmals nahmen die Einwohner von Neufundland und Labrador an einer bundesweiten Wahl teil. Diese Provinz war knapp vier Monate zuvor der Kanadischen Konföderation beigetreten.
Die Wahlbeteiligung betrug 73,8 %.[1]
Ergebnisse
Gesamtergebnis
| Partei | Vorsitzender | Kandi- daten |
Sitze 1945 |
Sitze 1949 |
+/− | Stimmen | Anteil | +/− | |
|---|---|---|---|---|---|---|---|---|---|
| Liberale Partei | Louis Saint-Laurent | 258 | 118 | 191 | + 73 | 2.874.813 | 49,15 % | + 9,37 % | |
| Progressiv-konservative Partei | George Alexander Drew | 249 | 66 | 41 | − 25 | 1.734.261 | 29,65 % | + 2,03 % | |
| Co-operative Commonwealth Federation | Major James Coldwell | 180 | 28 | 13 | − 15 | 784.770 | 13,42 % | − 2,13 % | |
| Social Credit Party | Solon Earl Low | 28 | 13 | 10 | − 3 | 135.217 | 2,31 % | − 1,73 % | |
| Unabhängige | 28 | 6 | 4 | − 2 | 119.827 | 2,05 % | − 2,84 % | ||
| Unabhängige Liberale | 15 | 8 | 1 | − 7 | 30.407 | 0,52 % | − 1,27 % | ||
| Liberal-Labour | 2 | 1 | + 1 | 11.730 | 0,20 % | + 0,19 % | |||
| Liberal-Progressive | 1 | 1 | 1 | 9.192 | 0,16 % | + 0,04 % | |||
| Union des électeurs | 56 | 86.087 | 1,47 % | + 1,46 % | |||||
| Labor-Progressive Party | Tim Buck | 17 | 1 | − 1 | 32.623 | 0,56 % | − 1,58 % | ||
| Unabhängige Progressiv-Konservative | 6 | 1 | − 1 | 8.195 | 0,14 % | − 0,14 % | |||
| Farmer-Labour | 1 | 6.161 | 0,11 % | + 0,04 % | |||||
| Parti national social chrétien | Adrien Arcand | 1 | 5.590 | 0,10 % | + 0,10 % | ||||
| Nationalisten | 1 | 4.994 | 0,09 % | + 0,09 % | |||||
| Independent Social Credit | 2 | 4.598 | 0,08 % | + 0,08 % | |||||
| Labour Party | 2 | 415 | 0,01 % | ||||||
| Sozialistische Arbeiterpartei | 1 | 271 | 0,01 % | + 0,01 % | |||||
| Bloc populaire canadien | 2 | − 2 | |||||||
| Unabhängiger CCF-Kandidat | 1 | − 1 | |||||||
| Gesamt | 851 | 245 | 262 | + 17 | 5.849.151 | 100,0 % | |||
Ergebnis nach Provinzen und Territorien
| Partei | BC | AB | SK | MB | ON | QC | NB | NS | PE | NL | NW/YK | Gesamt | ||
|---|---|---|---|---|---|---|---|---|---|---|---|---|---|---|
| Liberale Partei | Sitze | 11 | 5 | 14 | 11 | 55 | 68 | 8 | 10 | 3 | 5 | 1 | 191 | |
| Anteil in % | 36,7 | 33,8 | 43,4 | 45,1 | 45,1 | 60,4 | 53,8 | 52,7 | 49,2 | 71,9 | 49,0 | 49,1 | ||
| Progressiv-konservative Partei | Sitze | 3 | 2 | 1 | 1 | 25 | 2 | 2 | 2 | 1 | 2 | 41 | ||
| Anteil in % | 27,9 | 16,8 | 14,4 | 22,0 | 37,4 | 24,5 | 39,4 | 37,5 | 48,4 | 27,9 | 29,7 | |||
| Co-operative Commonwealth Federation | Sitze | 3 | 5 | 3 | 1 | 1 | 13 | |||||||
| Anteil in % | 31,5 | 10,0 | 40,9 | 25,9 | 15,2 | 1,1 | 4,2 | 9,9 | 2,4 | 0,2 | 17,0 | 13,4 | ||
| Social Credit Party | Sitze | 10 | 10 | |||||||||||
| Anteil in % | 0,5 | 37,4 | 0,9 | 0,2 | 2,3 | |||||||||
| Unabhängige | Sitze | 1 | 3 | 4 | ||||||||||
| Anteil in % | 2,6 | 2,1 | 0,1 | 6,1 | 0,2 | 34,0 | 2,1 | |||||||
| Unabhängige Liberale | Sitze | 1 | 1 | |||||||||||
| Anteil in % | 1,1 | 0,3 | 1,3 | 1,4 | 0,5 | |||||||||
| Liberal-Labour | Sitze | 1 | 1 | |||||||||||
| Anteil in % | 1,1 | 0,6 | < 0,1 | 0,2 | ||||||||||
| Liberal-Progressive | Sitze | 1 | 1 | |||||||||||
| Anteil in % | 2,9 | 0,2 | ||||||||||||
| Union des électeurs | Anteil in % | 0,1 | 5,1 | 1,0 | 1,5 | |||||||||
| Labor-Progressive Party | Anteil in % | 0,8 | 0,7 | 0,4 | 2,0 | 0,7 | 0,3 | 0,6 | ||||||
| Unabhängige Progressiv-Konservative | Anteil in % | < 0,1 | 0,5 | 0,1 | ||||||||||
| Farmer-Labour | Anteil in % | 0,3 | 0,1 | |||||||||||
| Parti national social chrétien | Anteil in % | 0,4 | 0,1 | |||||||||||
| Nationalisten | Anteil in % | 0,3 | 0,1 | |||||||||||
| Independent Social Credit | Anteil in % | 1,4 | 0,1 | |||||||||||
| Labour Party | Anteil in % | < 0,1 | < 0,1 | < 0,1 | ||||||||||
| Sozialistische Arbeiterpartei | Anteil in % | < 0,1 | < 0,1 | |||||||||||
| Sitze total | 18 | 17 | 20 | 16 | 83 | 73 | 10 | 13 | 4 | 7 | 1 | 262 | ||
Weblinks
- Elections Canada (Wahlbehörde)
Einzelnachweise
- Voter Turnout at Federal Elections and Referendums. Elections Canada, 18. Februar 2013, abgerufen am 4. Juli 2015 (englisch).
Siehe auch
1867 | 1872 | 1874 | 1878 | 1882 | 1887 | 1891 | 1896 | 1900 | 1904 | 1908 | 1911 | 1917 | 1921 | 1925 | 1926 | 1930 | 1935 | 1940 | 1945 | 1949 | 1953 | 1957 | 1958 | 1962 | 1963 | 1965 | 1968 | 1972 | 1974 | 1979 | 1980 | 1984 | 1988 | 1993 | 1997 | 2000 | 2004 | 2006 | 2008 | 2011 | 2015 | 2019 | 2021