Kanadische Unterhauswahl 1882
Die Kanadische Unterhauswahl 1882 (englisch 5th Canadian General Election, französisch 5e élection fédérale canadienne) war die 5. Wahl und fand am 20. Juni 1882 statt. Gewählt wurden 211 Abgeordnete des kanadischen Unterhauses (engl. House of Commons, frz. Chambre des Communes).
Die Wahl
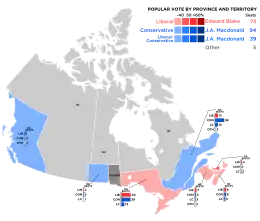
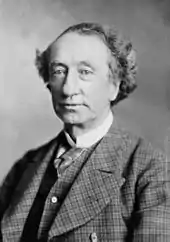
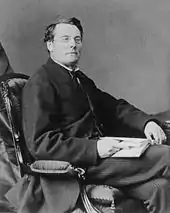
Die Konservative Partei von Premierminister John Macdonald konnte zusammen mit den Liberal-Konservativen ihre Mehrheit behaupten. Die von Edward Blake angeführte Liberale Partei verzeichnete zwar einige Sitzgewinne, schaffte es aber nicht, wieder an die Macht zu gelangen.
Die Wahlbeteiligung betrug 70,3 %.[1]
Ergebnisse
Gesamtergebnis
| Partei | Vorsitzender | Kandi- daten |
Sitze 1878 |
Sitze 1882 |
+/− | Stimmen | Wähler- anteil |
+/− | |
|---|---|---|---|---|---|---|---|---|---|
| Konservative Partei | John Macdonald | 118 | 85 | 94 | + 9 | 143.684 | 27,83 % | + 1,55 % | |
| Liberal-konservative Partei 1 | 50 | 49 | 39 | − 10 | 64.860 | 12,56 % | − 3,22 % | ||
| Liberale Partei | Edward Blake | 112 | 63 | 73 | + 10 | 160.547 | 31,10 % | − 1,95 % | |
| Unabhängige | 7 | 5 | 1 | − 4 | 8.227 | 1,59 % | − 1,12 % | ||
| Nationalistische Konservative | 1 | 1 | 1 | 1.084 | 0,21 % | + 0,14 % | |||
| Unabhängige Liberale | 3 | 1 | 2 | + 1 | 5.740 | 1,11 % | + 0,12 % | ||
| Unabhängige Konservative | 2 | 2 | 1 | − 1 | 927 | 0,18 % | + 0,18 % | ||
| nicht bekannt | 121 | 131.178 | 25,41 % | + 4,48 % | |||||
| Gesamt | 414 | 206 | 211 | + 5 | 516.247 | 100,0 % | |||
1 Die Liberal-Konservativen bildeten zusammen mit den Konservativen eine Fraktion im Unterhaus
Akklamationen
27 Abgeordnete wurden mangels Gegenkandidaten per Akklamation gewählt:
- British Columbia: 2 Liberal-Konservative
- Manitoba: 1 Konservativer
- Ontario: 2 Konservative
- Québec: 11 Konservative, 1 unabhängiger Konservativer, 4 Liberal-Konservative, 3 Liberale
- New Brunswick: 1 Liberal-Konservativer, 1 Unabhängiger
- Nova Scotia: 1 Konservativer
Ergebnis nach Provinzen
| Partei | BC | MB | ON | QC | NB | NS | PE | Gesamt | ||
|---|---|---|---|---|---|---|---|---|---|---|
| Konservative Partei | Sitze | 3 | 2 | 39 | 38 | 4 | 8 | 94 | ||
| Anteil in % | 38,4 | 13,6 | 27,0 | 37,7 | 25,6 | 23,0 | 17,1 | 27,8 | ||
| Liberal-konservative Partei | Sitze | 3 | 1 | 13 | 12 | 3 | 5 | 2 | 39 | |
| Anteil in % | 15,8 | 38,9 | 9,1 | 10,4 | 7,1 | 25,8 | 25,4 | 12,6 | ||
| Liberale Partei | Sitze | 2 | 40 | 12 | 7 | 8 | 4 | 73 | ||
| Anteil in % | 10,6 | 25,3 | 31,9 | 21,5 | 36,8 | 38,7 | 40,7 | 31,1 | ||
| Unabhängige | Sitze | 1 | 1 | |||||||
| Anteil in % | 1,7 | 0,8 | 0,4 | 4,8 | 1,6 | |||||
| Nationalistische Konservative | Sitze | 1 | 1 | |||||||
| Anteil in % | 1,0 | 0,2 | ||||||||
| Unabhängige Liberale | Sitze | 1 | 1 | 2 | ||||||
| Anteil in % | 0,7 | 1,5 | 6,2 | 1,1 | ||||||
| Unabhängige Konservative | Sitze | 1 | 1 | |||||||
| Anteil in % | 0,9 | 0,2 | ||||||||
| nicht bekannt | Anteil in % | 35,2 | 22,2 | 29,6 | 27,1 | 23,9 | 7,7 | 16,8 | 25,4 | |
| Sitze gesamt | 6 | 5 | 92 | 65 | 16 | 21 | 6 | 211 | ||
Weblinks
- Elections Canada (Wahlbehörde)
Einzelnachweise
- Voter Turnout at Federal Elections and Referendums. Elections Canada, 18. Februar 2013, abgerufen am 3. Juli 2015 (englisch).
Siehe auch
1867 | 1872 | 1874 | 1878 | 1882 | 1887 | 1891 | 1896 | 1900 | 1904 | 1908 | 1911 | 1917 | 1921 | 1925 | 1926 | 1930 | 1935 | 1940 | 1945 | 1949 | 1953 | 1957 | 1958 | 1962 | 1963 | 1965 | 1968 | 1972 | 1974 | 1979 | 1980 | 1984 | 1988 | 1993 | 1997 | 2000 | 2004 | 2006 | 2008 | 2011 | 2015 | 2019 | 2021