Parlamentswahl in der Türkei 1950
Die Wahl zur 9. Großen Nationalversammlung der Türkei fand am 14. Mai 1950 statt. Gewählt wurden die 487 Abgeordneten des nationalen Parlaments. Es handelte sich um die dritte demokratische Parlamentswahl, bei der mehrere Oppositionsparteien zur Wahl antreten durften.
Ergebnisse
Gesamtergebnis
| Partei | Stimmen | Sitze | ||
|---|---|---|---|---|
| Anzahl | % | |||
| Demokratische Partei (DP) | 4.391.694 | 54,54 | 415 | |
| Republikanische Volkspartei (CHP) | 3.148.626 | 39,11 | 69 | |
| Volkspartei (MP) | 368.537 | 4,58 | 1 | |
| Unabhängige | 44.537 | 0,55 | 2 | |
| Gesamt | 7.953.394 | 100,00 | 487 | |
| Registrierte Wähler | 8.905.743 | |||
| Quelle: Gaziosmanpaşa Üniversitesi[1] | ||||
Ergebnisse nach Provinzen
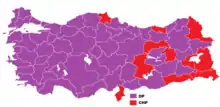
| İl | DP | CHP | Bağ | MP | Gewinner |
|---|---|---|---|---|---|
| Adana | 90.720 | 77.189 | 9.275 | 3.515 | DP |
| Afyon | 81.505 | 48.131 | 0 | 13.293 | DP |
| Ağrı | 34.115 | 18.797 | 0 | 0 | DP |
| Amasya | 33.824 | 29.548 | 0 | 0 | DP |
| Ankara | 146.876 | 126.081 | 0 | 26.196 | DP |
| Antalya | 67.867 | 37.025 | 0 | 0 | DP |
| Artvin | 30.691 | 23.765 | 0 | 1.956 | DP |
| Aydin | 76.896 | 60.860 | 0 | 2.820 | DP |
| Balikesir | 142.239 | 100.680 | 0 | 0 | DP |
| Bilecik | 32.613 | 27.772 | 0 | 0 | DP |
| Bingöl | 8.341 | 15.700 | 1.560 | 0 | CHP |
| Bitlis | 7.989 | 16.025 | 4.732 | 0 | CHP |
| Bolu | 80.675 | 38.577 | 0 | 4.032 | DP |
| Burdur | 29.783 | 14.479 | 20.419 | 189 | DP |
| Bursa | 138.445 | 97.532 | 0 | 0 | DP |
| Çanakkale | 77.296 | 40.180 | 189 | 0 | DP |
| Çankırı | 47.769 | 20.013 | 5.695 | 4.136 | DP |
| Çorum | 89.390 | 47.099 | 0 | 0 | DP |
| Denizli | 76.760 | 51.728 | 0 | 0 | DP |
| Diyarbakir | 53.691 | 48.000 | 0 | 0 | DP |
| Edirne | 47.715 | 36.238 | 10 | 4.178 | DP |
| Elazig | 37.983 | 32.972 | 0 | 0 | DP |
| Erzincan | 25.311 | 38.631 | 0 | 0 | CHP |
| Erzurum | 88.711 | 49.219 | 0 | 0 | DP |
| Eskişehir | 65.368 | 37.343 | 1.092 | 4.096 | DP |
| Gaziantep | 69.792 | 49.333 | 0 | 0 | DP |
| Giresun | 62.026 | 37.417 | 0 | 0 | DP |
| Gümüşhane | 36.778 | 29.616 | 13.049 | 0 | DP |
| Hakkari | 0 | 12.384 | 0 | 0 | CHP |
| Hatay | 49.240 | 53.818 | 0 | 0 | CHP |
| Isparta | 45.154 | 30.233 | 0 | 0 | DP |
| İçel | 73.269 | 43.814 | 0 | 1.124 | DP |
| İstanbul | 238.763 | 110.299 | 0 | 72.737 | DP |
| İzmir | 188.476 | 137.622 | 0 | 6.038 | DP |
| Kahramanmaraş | 52.823 | 39.045 | 26.121 | 0 | DP |
| Kars | 54.112 | 76.561 | 917 | 0 | CHP |
| Kastamonu | 70.422 | 63.809 | 0 | 26.307 | DP |
| Kayseri | 100.268 | 47.946 | 0 | 1.597 | DP |
| Kırklareli | 42.840 | 36.607 | 0 | 0 | DP |
| Kırşehir | 23.568 | 21.408 | 3.310 | 17.675 | DP |
| Kocaeli | 105.910 | 64.828 | 0 | 8.251 | DP |
| Konya | 163.222 | 111.139 | 1.573 | 0 | DP |
| Kütahya | 87.792 | 62.992 | 0 | 19.317 | DP |
| Malatya | 64.834 | 94.677 | 0 | 0 | CHP |
| Manisa | 128.199 | 90.412 | 0 | 0 | DP |
| Mardin | 45.078 | 44.882 | 47.771 | 0 | DP |
| Muğla | 53.719 | 43.842 | 0 | 0 | DP |
| Mus | 16.880 | 16.040 | 0 | 0 | DP |
| Niğde | 70.796 | 55.175 | 0 | 1.849 | DP |
| Ordu | 61.184 | 61.111 | 0 | 0 | DP |
| Rize | 42.038 | 18.021 | 0 | 0 | DP |
| Samsun | 98.336 | 71.678 | 0 | 884 | DP |
| Siirt | 22.144 | 15.363 | 0 | 0 | DP |
| Sinop | 9.522 | 55.348 | 0 | 23.196 | CHP |
| Sivas | 103.586 | 87.014 | 0 | 0 | DP |
| Şanlıurfa | 55.959 | 51.924 | 0 | 0 | DP |
| Tekirdag | 53.660 | 36.916 | 490 | 0 | DP |
| Tokat | 81.822 | 65.241 | 0 | 0 | DP |
| Trabzon | 60.871 | 63.684 | 0 | 6.839 | CHP |
| Tunceli | 13.089 | 9.209 | 0 | 0 | DP |
| Van | 16.785 | 20.653 | 10.374 | 0 | CHP |
| Yozgat | 68.969 | 50.866 | 0 | 0 | DP |
| Zonguldak | 107.863 | 62.020 | 0 | 0 | DP |
Siehe auch
Einzelnachweise
- Ergebnisse Parlamentswahlen 1950-2002 (Seite nicht mehr abrufbar, Suche in Webarchiven) Info: Der Link wurde automatisch als defekt markiert. Bitte prüfe den Link gemäß Anleitung und entferne dann diesen Hinweis. Gaziosmanpaşa Üniversitesi, PDF-Datei (türkisch)
Große Nationalversammlung: 1923 | 1927 | 1931 | 1935 | 1939 | 1943 | 1946 | 1950 | 1954 | 1957 | 1983 | 1987 | 1991 | 1995 | 1999 | 2002 | 2007 | 2011 | 2015 (Juni) | 2015 (November) | 2018 | 2023
Nationalversammlung: 1961 | 1965 | 1969 | 1973 | 1977
Senat der Republik: 1961 | 1964 | 1966 | 1968 | 1973 | 1975 | 1977 | 1979
Kommunen: 1930 | 1934 | 1938 | 1942 | 1946 | 1950 | 1955 | 1963 | 1968 | 1973 | 1977 | 1984 | 1989 | 1994 | 1999 | 2004 | 2009 | 2014 | 2019
Volksabstimmungen: 1961 | 1982 | 1987 | 1988 | 2007 | 2010 | 2017