Parlamentswahl in Südafrika 1994
Die Parlamentswahl in Südafrika 1994 fand vom 26. bis 29. April 1994 statt und war die erste Wahl in Südafrika, die unter den Bedingungen des allgemeinen Erwachsenenwahlrechts stattfand. Sie markierte damit das Ende der Rassentrennung durch die seit Anfang des 20. Jahrhunderts bestehende Apartheid-Politik in Südafrika. Die Wahl wurde unter der Aufsicht der Unabhängigen Wahlkommission Südafrikas (IEC) durchgeführt.
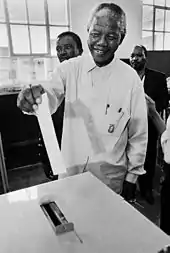
Während der vier Tage der Wahl bildeten Millionen von Menschen Schlangen vor den Wahllokalen. Insgesamt wurden 19.726.579 gültige Stimmen gezählt und 193.081 als ungültig gewertet. Der African National Congress unter der Führung von Nelson Mandela, dessen Kandidatenliste der Gewerkschaftsdachverband Congress of South African Trade Unions (COSATU) (Kongress der südafrikanischen Gewerkschaften) und die South African Communist Party (Südafrikanische Kommunistische Partei) einschloss, verfehlte knapp die Zweidrittelmehrheit der Stimmen. Die Führung des ANC entschied sich für die Bildung einer Regierung der Nationalen Einheit zusammen mit der von Frederik Willem de Klerk geführten ehemaligen Apartheids- und Regierungspartei National Party und der Zulu-Partei Inkatha Freedom Party.
Der 27. April ist im Gedenken an diese Wahl als Freedom Day der Nationalfeiertag Südafrikas.
Ergebnisse der Parlamentswahl
| Partei | Kürzel | Stimmen | % | Sitze | |
|---|---|---|---|---|---|
| African National Congress | ANC | 12.237.655 | 62,65 | 252 | |
| National Party | NP | 3.983.690 | 20,39 | 82 | |
| Inkatha Freedom Party | IFP | 2 058 294 | 10,54 | 43 | |
| Vryheidsfront | FF-VF | 424.555 | 2,17 | 9 | |
| Democratic Party | DP | 338.426 | 1,73 | 7 | |
| Pan Africanist Congress of Azania | PAC | 243.478 | 1,25 | 5 | |
| African Christian Democratic Party | ACDP | 88.104 | 0,45 | 2 | |
| Africa Muslim Party | AMP | 34.466 | 0,18 | ||
| African Moderates Congress Party | AMCP | 27.690 | 0,14 | ||
| Dikwankwetla Party of South Africa | DPSA | 19.451 | 0,10 | ||
| Federal Party | FP | 17.663 | 0,09 | ||
| Minority Front | MF | 13.433 | 0,07 | ||
| Sport Organisation for Collective Contributions and Equal Rights | SOCCER | 10.575 | 0,05 | ||
| African Democratic Movement | ADM | 9.886 | 0,05 | ||
| Women's Rights Peace Party | WRPP | 6.434 | 0,03 | ||
| Ximoko Progressive Party | XPP | 6.320 | 0,03 | ||
| Keep It Straight and Simple Party | KISS | 5.916 | 0,03 | ||
| Workers' List Party | WLP | 4.169 | 0,02 | ||
| Luso-South African Party | LUSO | 3.293 | 0,02 | ||
| Gesamt | 19.533.498 | 100,00 | 400 | ||
Gesamtergebnis der Wahlen zu den Provinzvertretungen
| Partei | Stimmen | % | Sitze | |
|---|---|---|---|---|
| African National Congress (ANC) | 12.137.307 | 62,3 | 266 | |
| National Party (NP) | 3.492.467 | 17,9 | 82 | |
| Inkatha Freedom Party (IFP) | 2.047.083 | 10,5 | 44 | |
| Vryheidsfront (FF-VF) | 639.643 | 3,3 | 14 | |
| Democratic Party (DP) | 538.655 | 2,8 | 12 | |
| Pan Africanist Congress of Azania (PAC) | 271.793 | 1,4 | 3 | |
| African Christian Democratic Party (ACDP) | 117.825 | 0,6 | 3 | |
| Minority Front (MF) | 48.951 | 0,3 | 1 | |
| Africa Muslim Party (AMP) | 51.773 | 0,3 | ||
| African Democratic Movement (ADM) | 34.233 | 0,2 | ||
| Dikwankwetla Party of South Africa (DPSA) | 21.877 | 0,1 | ||
| Islamic Party (IP) | 16.762 | 0,1 | ||
| Federal Party (FP) | 16.279 | 0,1 | ||
| United People's Front (UPF) | 10.123 | 0,1 | ||
| Ximoko Progressive Party (XPP) | 8.238 | 0,0 | ||
| Women's Rights Peace Party (WRPP) | 7.279 | 0,0 | ||
| Wes-Kaap Federaliste Party (WKFP) | 6.337 | 0,0 | ||
| Workers International to Rebuild the Fourth International (SA) (WI) | 5.481 | 0,0 | ||
| Luso-South African Party (LUSO) | 5.423 | 0,0 | ||
| South African Women's Party (SAWP) | 2.641 | 0,0 | ||
| Green Party (GRP) | 2.611 | 0,0 | ||
| Merit Party (MP) | 2.028 | 0,0 | ||
| Right Party (RP) | 921 | 0,0 |
Weblinks
- U.S. Department of the Army, South Africa Country Study, The 1994 Elections
- elections.org.za: 1994 National and Provincial Elections
- Proportional representation and alternative systems (Memento vom 4. Mai 2013 im Internet Archive)