Perth and North Perthshire
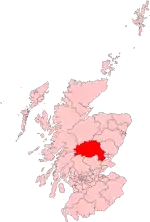
Perth and North Perthshire ist ein Wahlkreis für das britische Unterhaus. Er wurde im Zuge der Wahlkreisreform 2005 aus Teilen des Wahlkreises Angus sowie der aufgelösten Wahlkreise Ochil, Perth and North Tayside neu gebildet. Perth and North Perthshire umfasst die nördlichen Gebiete der Council Area Perth and Kinross mit der Stadt Perth.[1] Die übrigen Teile von Perth and Kinross sind im Wahlkreis Ochil and South Perthshire zusammengefasst, der auch die Council Area Clackmannanshire vollständig abdeckt. Der Wahlkreis entsendet einen Abgeordneten.
| Perth and North Perthshire |
|---|
 |
| Gebildet |
| 2005 |
| Abgeordneter |
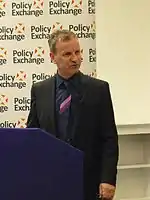
| Pete Wishart (SNP)
|
| Regionen |
| Perth and Kinross |
Wahlergebnisse
Unterhauswahlen 2005
| Ergebnisse der Unterhauswahlen 2005[2] | |||
|---|---|---|---|
| Partei | Kandidat | Stimmen | % |
| SNP | Pete Wishart | 15.469 | 33,7 |
| Conservative | Douglas Taylor | 13.948 | 30,4 |
| Labour | Doug Maughan | 8601 | 18,7 |
| Liberal Democrats | Gordon Campbell | 7403 | 16,1 |
| Socialist | Philip Stott | 509 | 1,1 |
Unterhauswahlen 2010
| Ergebnisse der Unterhauswahlen 2010[3] | ||||
|---|---|---|---|---|
| Partei | Kandidat | Stimmen | % | ± |
| SNP | Pete Wishart | 19.118 | 39,6 | +5,9 |
| Conservative | Peter Lyburn | 14.739 | 30,5 | +0,1 |
| Labour | Jamie Glackin | 7923 | 16,4 | −2,3 |
| Liberal Democrats | Peter Barrett | 5954 | 12,3 | −3,8 |
| Trust | Douglas Taylor | 534 | 1,1 | +1,1 |
Unterhauswahlen 2015
| Ergebnisse der Unterhauswahlen 2015[4] | ||||
|---|---|---|---|---|
| Partei | Kandidat | Stimmen | % | ± |
| SNP | Pete Wishart | 27.379 | 50,5 | +10,9 |
| Conservative | Alexander Stewart | 17.738 | 32,7 | +2,2 |
| Labour | Scott Nicholson | 4413 | 8,1 | −8,3 |
| Liberal Democrats | Peter Barrett | 2059 | 3,8 | −8,5 |
| Green | Louise Ramsay | 1146 | 2,1 | +2,1 |
| UKIP | John Myles | 1110 | 2,0 | +2,0 |
| Parteilos | Xander McDade | 355 | 0,7 | +0,7 |
Unterhauswahlen 2017
| Ergebnisse der Unterhauswahlen 2017[4] | ||||
|---|---|---|---|---|
| Partei | Kandidat | Stimmen | % | ± |
| SNP | Pete Wishart | 21.804 | 42,3 | −8,2 |
| Conservative | Ian Duncan | 21.783 | 42,3 | +9,6 |
| Labour | Alison Dowling | 5349 | 10,4 | +2,3 |
| Liberal Democrats | Peter Barrett | 2589 | 5,0 | +1,2 |
Einzelnachweise
- Landkarte des Wahlkreises
- Ergebnisse der Unterhauswahlen 2005 (Memento des Originals vom 3. Dezember 2013 im Internet Archive) Info: Der Archivlink wurde automatisch eingesetzt und noch nicht geprüft. Bitte prüfe Original- und Archivlink gemäß Anleitung und entferne dann diesen Hinweis.
- Ergebnisse der Unterhauswahlen 2010
- Ergebnisse der Unterhauswahlen 2015
This article is issued from Wikipedia. The text is licensed under Creative Commons - Attribution - Sharealike. The authors of the article are listed here. Additional terms may apply for the media files, click on images to show image meta data.
