Airdrie and Shotts (Wahlkreis, Vereinigtes Königreich)
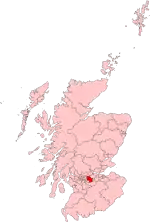
Airdrie and Shotts ist ein Wahlkreis für das Britische Unterhaus. Er wurde 1997 geschaffen und deckt Teile der Council Area North Lanarkshire ab. Die größte Stadt innerhalb seiner Grenzen ist das namensgebende Airdrie.[1] Der Wahlkreis ist deckungsgleich mit dem gleichnamigen Wahlkreis für das schottische Parlament. Es wird ein Abgeordneter entsandt.
| Airdrie and Shotts |
|---|
 |
| Gebildet |
| 1997 |
| Abgeordneter |
| Neil Gray (SNP) |
| Regionen |
| North Lanarkshire |
Wahlergebnisse
Unterhauswahlen 1997
| Ergebnisse der Unterhauswahlen 1997[2] | |||
|---|---|---|---|
| Partei | Kandidat | Stimmen | % |
| Labour | Helen Liddell | 25.460 | 61,8 |
| SNP | Keith R.A. Robertson | 10.048 | 24,4 |
| Conservative | Nicholas H. Brook | 3660 | 8,9 |
| Liberal Democrats | Richard G. Wolseley | 1719 | 4,2 |
| Referendum | Crawford Semple | 294 | 0,7 |
Unterhauswahlen 2001
| Ergebnisse der Unterhauswahlen 2001[2] | ||||
|---|---|---|---|---|
| Partei | Kandidat | Stimmen | % | ± |
| Labour | Helen Liddell | 18.472 | 58,2 | −3,6 |
| SNP | Alison Lindsay | 6138 | 19,3 | −5,1 |
| Liberal Democrats | John Love | 2376 | 7,5 | +3,3 |
| Conservative | Gordon McIntosh | 1960 | 6,2 | −2,7 |
| Scottish Unionist | Mark Dempsey | 1439 | 4,5 | +4,5 |
| Socialist | Kenny McGuigan | 1171 | 3,7 | +3,7 |
| Socialist Labour | Christ Herriot | 174 | 0,5 | +0,5 |
Unterhauswahlen 2005
| Ergebnisse der Unterhauswahlen 2005[3] | ||||
|---|---|---|---|---|
| Partei | Kandidat | Stimmen | % | ± |
| Labour | John Reid | 19.568 | 59,0 | +0,8 |
| SNP | Malcolm Balfour | 5484 | 16,5 | −2,8 |
| Liberal Democrats | Helen Watt | 3792 | 11,4 | +3,9 |
| Conservative | Stuart Cottis | 3272 | 9,9 | +3,7 |
| Socialist | Fraser Coats | 706 | 2,1 | −1,6 |
| Scottish Independence | Joseph Rowan | 337 | 1,0 | +1,0 |
Unterhauswahlen 2010
| Ergebnisse der Unterhauswahlen 2010[4] | ||||
|---|---|---|---|---|
| Partei | Kandidat | Stimmen | % | ± |
| Labour | Pamela Nash | 20.849 | 58,2 | −0,8 |
| SNP | Sophia Coyle | 8441 | 23,6 | +7,1 |
| Conservative | Ruth Whitfield | 3133 | 8,7 | −1,2 |
| Liberal Democrats | John Love | 2898 | 8,1 | −3,3 |
| Parteilos | John McGeechan | 528 | 1,5 | +1,5 |
Unterhauswahlen 2015
| Ergebnisse der Unterhauswahlen 2015[5] | ||||
|---|---|---|---|---|
| Partei | Kandidat | Stimmen | % | ± |
| SNP | Neil Gray | 23.887 | 53,9 | +30,3 |
| Labour | Pamela Nash | 15.108 | 34,1 | −24,1 |
| Conservative | Eric Holford | 3389 | 7,7 | −1,0 |
| UKIP | Matt Williams | 1088 | 2,5 | +2,5 |
| Liberal Democrats | John Love | 678 | 1,5 | −6,6 |
| Parteilos | Deryck Beaumont | 136 | 0,3 | +0,3 |
Unterhauswahlen 2017
| Ergebnisse der Unterhauswahlen 2017[5] | ||||
|---|---|---|---|---|
| Partei | Kandidat | Stimmen | % | ± |
| SNP | Neil Gray | 14.291 | 37,6 | −16,3 |
| Labour | Helen McFarlane | 14.096 | 37,1 | +3,0 |
| Conservative | Jennifer Donnellan | 8813 | 23,3 | +15,5 |
| Liberal Democrats | Ewan McRobert | 802 | 2,1 | +0,6 |
Einzelnachweise
- Landkarte des Wahlkreises
- Ergebnisse der Unterhauswahlen 1997 und 2001
- Ergebnisse der Unterhauswahlen 2005 (Memento vom 24. September 2015 im Internet Archive)
- Ergebnisse der Unterhauswahlen 2010 (Memento vom 20. Februar 2016 im Internet Archive)
- Ergebnisse der Unterhauswahlen 2015
This article is issued from Wikipedia. The text is licensed under Creative Commons - Attribution - Sharealike. The authors of the article are listed here. Additional terms may apply for the media files, click on images to show image meta data.