Matplotlib
Matplotlib ist eine Programmbibliothek für die Programmiersprache Python, die es erlaubt, mathematische Darstellungen aller Art anzufertigen.
| Matplotlib | |
|---|---|
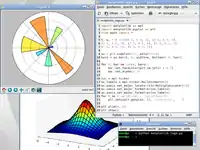 Eine Zusammenstellung aus fertigen Graphen und dem dazugehörigen Programmcode. | |
| Basisdaten | |
| Entwickler | John D. Hunter |
| Erscheinungsjahr | 2003[1] |
| Aktuelle Version | 3.5.0[2] (16. November 2021) |
| Betriebssystem | plattformunabhängig |
| Programmiersprache | Python |
| Kategorie | Programmbibliothek |
| Lizenz | Matplotlib-Lizenz |
| matplotlib.org | |
Beschreibung
Matplotlib kann mit Python 2.x (bis Matplotlib 2.2.x) und 3.x verwendet werden und funktioniert auf allen gängigen Betriebssystemen. Dabei wird eine Python-ähnliche objektorientierte Schnittstelle verwendet. Nach dem Importieren der Bibliothek kann man graphische Darstellungen mithilfe der Python-Konsole erzeugen. Man kann jedoch auch Matplotlib in bestehende Python-Programme integrieren. Dazu verwendet Matplotlib Anbindungen zu GUI-Bibliotheken wie GTK+, Qt, wxWidgets und Tk. Die Grafiken können in einer Vielzahl von Formaten erstellt werden, z. B.: SVG, PNG, Anti-Grain Geometry, EPS, PDF.
Entwicklung
Die erste Version von Matplotlib wurde von John D. Hunter in den Jahren 2002 und 2003 entwickelt.[3] Gleich zu Beginn war es als freie Open-Source-Bibliothek gedacht. Heute wird die Entwicklung auf GitHub von vielen Personen vorangetrieben.[4]
Beispiele
Kurven
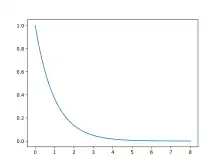
>>> import matplotlib.pyplot as plt
>>> import numpy as np
>>> a = np.linspace(0, 8, 501)
>>> b = np.exp(-a)
>>> plt.plot(a, b)
>>> plt.show()
Histogramm
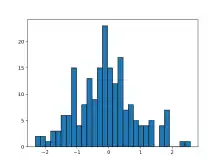
>>> import matplotlib.pyplot as plt
>>> from numpy.random import normal,rand
>>> x = normal(size=200)
>>> plt.hist(x, bins=30, edgecolor='black')
>>> plt.show()
Streudiagramm
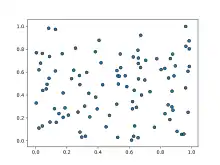
>>> import matplotlib.pyplot as plt
>>> from numpy.random import rand
>>> a = rand(100)
>>> b = rand(100)
>>> plt.scatter(a, b, edgecolor='black')
>>> plt.show()
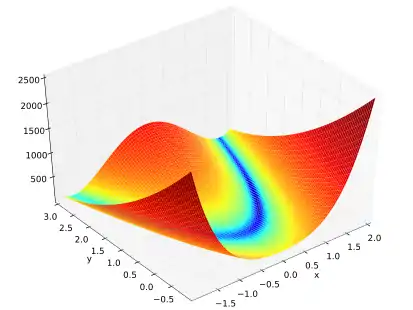
3D-Plot
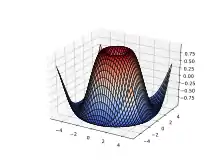
>>> from matplotlib import cm
>>> from mpl_toolkits.mplot3d import Axes3D
>>> import matplotlib.pyplot as plt
>>> import numpy as np
>>> fig = plt.figure()
>>> ax = fig.add_subplot(projection='3d')
>>> X = np.arange(-5, 5, 0.25)
>>> Y = np.arange(-5, 5, 0.25)
>>> X, Y = np.meshgrid(X, Y)
>>> R = np.sqrt(X**2 + Y**2)
>>> Z = np.sin(R)
>>> surf = ax.plot_surface(X, Y, Z, rstride=1, cstride=1, cmap=cm.coolwarm, edgecolor='black')
>>> plt.show()
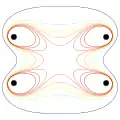
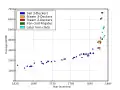
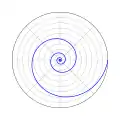
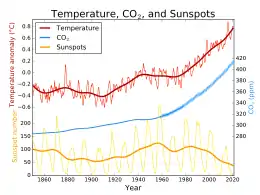
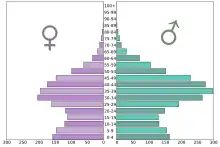
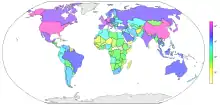
Weitere Beispiele
Weblinks
- Offizielle Website
- Github-Seite von Matplotlib
- Matplotlib: Lessons from middle age – Video, in dem John D. Hunter die Entwicklung des Projekts beschreibt
- Matplotlib-Anleitung „SciPy Cookbook“ (englisch)
Einzelnachweise
- matplotlib.org.
- Release 3.5.0.
- John D. Hunter: Matplotlib: A 2D Graphics Environment. In: Computing in Science & Engineering. 9, Nr. 3, Februar, S. 90–95. doi:10.1109/MCSE.2007.55.
- Matplotlib Credits. In: Matplotlib. Matplotlib. Abgerufen am 7. August 2014.