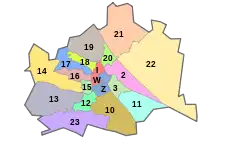
Landtags- und Gemeinderatswahlkreis Floridsdorf
Der Wahlkreis Floridsdorf ist ein Wahlkreis in Wien, der den Wiener Gemeindebezirk Floridsdorf umfasst. Bei der Landtags- und Gemeinderatswahl 2015 waren im Wahlkreis Floridsdorf 105.431 Personen wahlberechtigt, wobei bei der Wahl die Freiheitliche Partei Österreichs (FPÖ) mit 40,56 % als stärkste Partei hervorging.[2] Die FPÖ und die Sozialdemokratische Partei Österreichs (SPÖ) erzielten bei der Wahl je vier der zehn möglichen Grundmandate.[3]
| Wahlkreis 21: Floridsdorf | |
|---|---|
 | |
| Staat | Österreich |
| Bundesland | Wien |
| Wahlkreisnummer | 21 |
| Anzahl der Mandate | 10 |
| Einwohner | 173.916 (1. Jänner 2021)[1] |
| Wahlberechtigte | 105.431 (2015)[2] |
| Wahlbeteiligung | 75,23 % (2015)[2] |
| Wahldatum | 11. Oktober 2015 |
| Abgeordnete | |
| |
Wahlergebnisse
Gemeinderatswahl im Wahlkreis Floridsdorf 2015
%
50
40
30
20
10
0
39,16 %
(−7,96 %p)
(−7,96 %p)
40,56 %
(+7,30 %p)
(+7,30 %p)
6,53 %
(−3,05 %p)
(−3,05 %p)
6,31 %
(−0,85 %p)
(−0,85 %p)
4,08 %
(+3,48 %p)
(+3,48 %p)
3,36 %
(+1,08 %p)
(+1,08 %p)
2010
2015
Anmerkungen:
e Wahlergebnis 2010 LIF
| Landtags- und Gemeinderatswahlen im Wahlkreis Floridsdorf[4] | ||||||||
|---|---|---|---|---|---|---|---|---|
| Wahltermin | GM[5] | SPÖ | ÖVP | FPÖ | GRÜNE[6] | LIF/NEOS | Sonstige | |
| 8. Oktober 1978 | Stimmenanteile (%) | 67,68 | 23,71 | 5,11 | – | – | 3,51 | |
| 7 | Grundmandate | 5 | 1 | 0 | – | – | 0 | |
| 24. April 1983 | Stimmenanteile (%) | 65,61 | 24,94 | 4,91 | 1,73 | – | 2,82 | |
| 8 | Grundmandate | 5 | 2 | 0 | 0 | – | 0 | |
| 18. November 1987 | Stimmenanteile (%) | 64,54 | 19,73 | 8,74 | 3,85 | – | 3,15 | |
| 8 | Grundmandate | 5 | 1 | 0 | 0 | – | 0 | |
| 10. November 1991 | Stimmenanteile (%) | 56,26 | 12,83 | 21,42 | 7,29 | – | 2,20 | |
| 8 | Grundmandate | 5 | 1 | 1 | 0 | – | 0 | |
| 13. Oktober 1996 | Stimmenanteile (%) | 45,65 | 10,81 | 29,52 | 5,84 | 6,45 | 1,73 | |
| 9 | Grundmandate | 4 | 1 | 2 | 0 | 0 | 0 | |
| 25. März 2001 | Stimmenanteile (%) | 55,57 | 11,99 | 20,49 | 8,55 | 2,78 | 0,62 | |
| 9 | Grundmandate | 5 | 1 | 2 | 0 | 0 | 0 | |
| 23. Oktober 2005 | Stimmenanteile (%) | 57,76 | 13,12 | 16,99 | 9,07 | – | 3,06 | |
| 10 | Grundmandate | 6 | 1 | 1 | 0 | – | 0 | |
| 10. Oktober 2010 | Stimmenanteile (%) | 47,12 | 9,58 | 33,26 | 7,16 | 0,60 | 2,28 | |
| 10 | Grundmandate | 5 | 1 | 3 | 0 | 0 | 0 | |
| 11. Oktober 2015 | Stimmenanteile (%) | 39,16 | 6,53 | 40,56 | 6,31 | 4,08 | 3,36 | |
| 10 | Grundmandate | 4 | 0 | 4 | 0 | 0 | 0 | |
| 11. Oktober 2020 | Stimmenanteile (%) | |||||||
| 10 | Grundmandate | |||||||
Einzelnachweise
- Statistik Austria - Bevölkerung zu Jahresbeginn 2002–2021 nach Gemeinden (Gebietsstand 1.1.2021)
- Stadt Wien Wahlergebnis der Gemeinderatswahl 2015
- Stadt Wien Wahlergebnis der Gemeinderatswahl 2015 im Wahlkreis Floridsdorf
- Wahlstatistik. Die Wahlen in den Bundesländern seit 1945. S. 436–469 bzw. Land Wien Wahlergebnisse bei Landtags- und Gemeinderatswahlen
- Anzahl der Grundmandate im Wahlkreis Floridsdorf
- 1983 ALW
Literatur
- Verbindungsstelle der Bundesländer beim Amt der Niederösterreichischen Landesregierung: Wahlstatistik. Die Wahlen in den Bundesländern seit 1945. Nationalrat und Landtage. 8. Auflage, Wien 1994
Weblinks
- Wiener Landtags- und Gemeinderatswahlen auf den Seiten des Landes Wien
This article is issued from Wikipedia. The text is licensed under Creative Commons - Attribution - Sharealike. The authors of the article are listed here. Additional terms may apply for the media files, click on images to show image meta data.