Einwohnerentwicklung von Bytom
Dieser Artikel gibt die Einwohnerentwicklung von Beuthen O.S./Bytom, das in der Woiwodschaft Schlesien im südlichen Teil Polens liegt, tabellarisch und grafisch wieder.

Stadtwappen
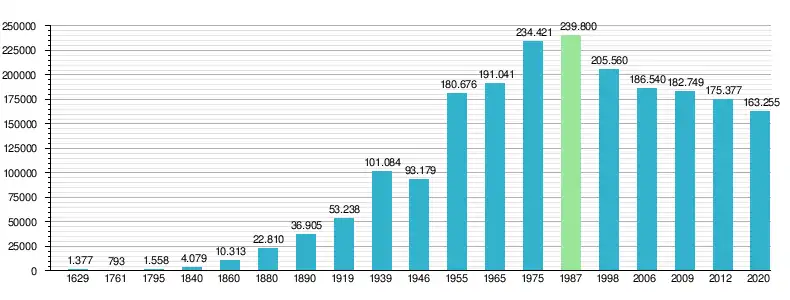
Am 30. Juni 2012 betrug die Amtliche Einwohnerzahl von Bytom 175.377. Die höchste Einwohnerzahl hatte die kreisfreie Großstadt nach Angaben der GUS im Jahr 1987 mit 239.800 Einwohnern. Bis zum 31. Dezember 2020 sank die Einwohnerzahl auf 163.255.
Einwohnerentwicklung

Einwohnerentwicklung von Bytom
- 1629 – 1 377
- 1754 – 1 131
- 1761 – 793
- 1795 – 1 558
- 1800 – 1 707
- 1810 – 1 926
- 1820 – 2 000
- 1840 – 4 079
- 1860 – 10 313
- 1871 – 15 711
- 1880 – 22 810
- 1885 – 26 484
- 1890 – 36 905
- 1900 – 51 404
- 1905 – 60 273
- 1910 – 67 718
- 1919 – 53 238
- 1925 – 62 543
- 1933 – 100 584
- 1935 – 103 332
- 1939 – 101 084
- 1946 – 93 179 (a)
- 1950 – 173 955 (a)
- 1955 – 180 676
- 1960 – 182 578 (a)
- 1961 – 186 200
- 1962 – 189 700
- 1963 – 191 400
- 1964 – 191 700
- 1965 – 191 041
- 1966 – 190 900
- 1967 – 186 800
- 1968 – 186 800
- 1969 – 186 900
- 1970 – 187 500
- 1971 – 187 151
- 1972 – 189 100
- 1973 – 192 600
- 1974 – 199 400
- 1975 – 234 421 (Eingemeindung von Radzionków)
- 1976 – 236 100
- 1977 – 236 500
- 1978 – 231 500 (a)
- 1979 – 231 600
- 1980 – 234 292
- 1981 – 237 828
- 1982 – 238 172
- 1983 – 238 058
- 1984 – 239 217
- 1985 – 238 925
- 1986 – 239 453
- 1987 – 239 800
- 1988 – 227 917 (a)
- 1989 – 229 851
- 1990 – 231 206
- 1991 – 232 239
- 1992 – 229 243
- 1993 – 229 605
- 1994 – 228 165
- 1995 – 226 810
- 1996 – 225 287
- 1997 – 225 799
- 1998 – 205 560 (Ausgliederung von Radzionków)
- 1999 – 203 795
- 2000 – 201 942
- 2001 – 200 244
- 2002 – 192 597 (a)
- 2003 – 191 060
- 2004 – 189 535
- 2005 – 187 943
- 2006 – 186 540
- 2007 – 184 765
- 2008 – 183 829
- 2009 – 182 749
- 2010 – 181 617[1]
- 2012 – 175 377 (30. Juni)[2]
- 2010 – 163 255[3]
a = Volkszählungsergebnis
Graphische Darstellung
Stadtfläche
- 1995 – 82,58 km²
- 1998 – 69,32 km²
- 2003 – 69,43 km²
- 2006 – 69,44 km²
Literatur
- 1939–1979: Roczniki statystyczne GUS
- 1980–1994: Roczniki demograficzne GUS
- 1995–2007: Bank danych regionalnych GUS
Einzelnachweise
- Ludność. Stan i struktura w przekroju terytorialnym. Stan w dniu 31 XII 2010 (Memento des Originals vom 27. November 2011 im Internet Archive) Info: Der Archivlink wurde automatisch eingesetzt und noch nicht geprüft. Bitte prüfe Original- und Archivlink gemäß Anleitung und entferne dann diesen Hinweis.
- Ludność. Stan i struktura w przekroju terytorialnym. Stan w dniu 30 VI 2012 (PDF; 626 kB)
- Ludność. Stan i struktura ludności oraz ruch naturalny w przekroju terytorialnym (stan w dniu 31.12.2020)
This article is issued from Wikipedia. The text is licensed under Creative Commons - Attribution - Sharealike. The authors of the article are listed here. Additional terms may apply for the media files, click on images to show image meta data.