Wahlen in Massachusetts 1918
Die Wahlen in Massachusetts 1918 fanden am 5. November 1918 im US-Bundesstaates Massachusetts statt.
| ‹ 1917 • | |||||||||||
| Wahl eines Gouverneurs in Massachusetts | |||||||||||
| 5. November 1918 | |||||||||||
.jpg.webp) |
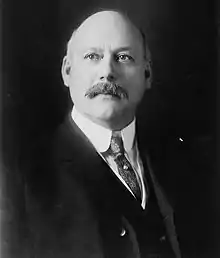
Republikanische Partei | ||||||||||
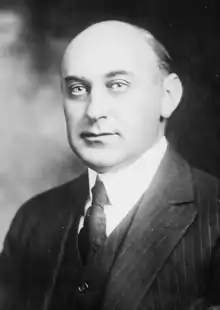
| Calvin Coolidge | |||||||||||
| Stimmen | 214.863 | ||||||||||
| 50,9 % | |||||||||||
 |
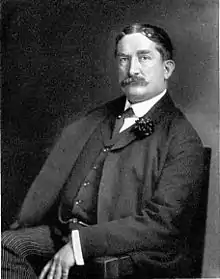
Demokratische Partei | ||||||||||
| Richard H. Long | |||||||||||
| Stimmen | 197.828 | ||||||||||
| 46,8 % | |||||||||||
| Ergebnis nach County | |||||||||||
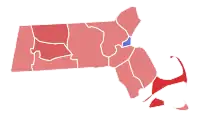 | |||||||||||
Coolidge |
Long |
||||||||||
Gewählt wurden auf bundesstaatlicher Ebene für das folgende Jahr 240 Repräsentanten und 40 Senatoren für den Massachusetts General Court sowie wichtige Regierungsämter (Gouverneur, Vizegouverneur, Secretary of the Commonwealth, State Treasurer, State Auditor und Attorney General) und die acht gewählten Mitglieder des Governor’s Council. Auf kommunaler Ebene wurde in den meisten Countys einer der drei County Commissioners gewählt. Außerdem wurden im Rahmen der bundesweiten Kongresswahlen 1918 einer der beiden US-Senatoren aus diesem Bundesstaat und die 16 Abgeordnete für Massachusetts im Repräsentantenhaus gewählt.
Der Republikaner und bisherige Vizegouverneur Calvin Coolidge wurde mit 50,9 % der Stimmen zum neuen Gouverneur gewählt. Als neuer Vizegouverneur wurde an seiner Stelle Channing H. Cox gewählt. Der bisherige republikanische Gouverneur Samuel W. McCall war aufgrund seiner Vorwahlskandidatur für den Senat nicht erneut angetreten.
Vorwahlen
Demokraten
| Kandidat | Amt | Stimmen[1] | Anteil |
|---|---|---|---|
| Richard H. Long | 23.546 | 38,7 % | |
| William A. Gaston | Kandidat bei den Gouverneurswahlen 1902 und 1903 | 20.968 | 34,4 % |
| Edward P. Barry | Ehemaliger Vizegouverneur | 16.411 | 26,9 % |
| Sonstige | 3 | 0 % |
| Kandidat | Amt | Stimmen[2] | Anteil |
|---|---|---|---|
| Joseph H. O’Neil | Ehemaliger Kongressabgeordneter | 3.948 | 95,0 % |
| Sonstige | 208 | 5,0 % |
Republikaner
| Kandidat | Amt | Stimmen[2] | Anteil |
|---|---|---|---|
| Calvin Coolidge | Amtierender Vizegouverneur | 81.238 | 100 % |
| Sonstige | 22 | 0 % |
| Kandidat | Amt | Stimmen[2] | Anteil |
|---|---|---|---|
| Channing H. Cox | Amtierender Sprecher des Repräsentantenhauses von Massachusetts | 58.481 | 68,5 % |
| Guy Andrew Ham | Kandidat in den Vorwahlen für das Amt 1915 | 26.957 | 31,6 % |
| Sonstige | 1 |
Exekutive
Gouverneur
| Partei | Kandidat | Stimmen[3] | Anteil | Veränderung |
|---|---|---|---|---|
| Republikanische Partei | Calvin Coolidge | 214.863 | 50,9 % | 7,4 |
| Demokratische Partei | Richard H. Long | 197.828 | 46,8 % | 11,8 |
| Socialist Party | Sylvester J. McBridge | 7.757 | 1,8 % | 2,5 |
| Socialist Labor Party | Ingvar Paulsen | 1.913 | 0,5 % | 0,9 |
| Sonstige | 9 | 0 % |
Vizegouverneur
| Partei | Kandidat | Stimmen[3] | Anteil | Veränderung |
|---|---|---|---|---|
| Republikanische Partei | Channing H. Cox | 222.704 | 54,0 % | 6,4 |
| Demokratische Partei | Joseph H. O’Neil | 179.709 | 43,5 % | 10,6 |
| Socialist Labor Party | Oscar Kinsalas | 10.157 | 2,5 % | 1,0 |
| Sonstige | 100 | 0 % |
Secretary of the Commonwealth
| Partei | Kandidat | Stimmen[3] | Anteil |
|---|---|---|---|
| Republikanische Partei | Albert P. Langtry | 226.836 | 56,3 % |
| Demokratische Partei | Charles H. McGlue | 166.359 | 41,3 % |
| Socialist Labor Party | William Taylor | 9.862 | 2,4 % |
| Sonstige | 83 | 0 % |
State Treasurer
| Partei | Kandidat | Stimmen[3] | Anteil |
|---|---|---|---|
| Republikanische Partei | Charles L. Burrill | 224.702 | 56,1 % |
| Demokratische Partei | Charles Giddings | 166.163 | 41,5 % |
| Socialist Labor Party | Mary E. Peterson | 9.418 | 2,4 % |
| Sonstige | 86 | 0 % |
State Auditor
| Partei | Kandidat | Stimmen[4] | Anteil |
|---|---|---|---|
| Republikanische Partei | Alonzo B. Cook | 221.903 | 56 % |
| Demokratische Partei | Francis M. Costello | 165.673 | 41,8 % |
| Socialist Labor Party | Fred E. Oelcher | 8.503 | 2,1 % |
| Sonstige | 101 | 0 % |
Attorney General
| Partei | Kandidat | Stimmen[4] | Anteil |
|---|---|---|---|
| Republikanische Partei | Henry Converse Atwill | 228.015 | 57,2 % |
| Demokratische Partei | Joseph L. P. St. Coeur | 159.217 | 39,9 % |
| Socialist Labor Party | Morris I. Becker | 11.393 | 2,9 % |
| Sonstige | 94 | 0 % |
Governor’s Council
Der Governor’s Council berät den Gouverneur und muss bei der Besetzung verschiedener Ämter, Begnadigungen, Strafmilderungen sowie Optionsscheinen aus dem Staatshaushalt zustimmen.[5] Die republikanische Kandidaten sich in den acht Wahlbezirken für den Governor’s Council durchsetzen konnten. Da die Republikaner auch den Vizegouverneur stellten, welcher Kraft seines Amts Mitglied des Rates ist, bestand der Governor’s Council des nächsten Jahres nur aus Republikaner.[6]
| Partei | Kandidat | Stimmen | Anteil |
|---|---|---|---|
| Republikanische Partei | Harry H. Williams | 37.704 | 100 % |
| Sonstige | 14 | 0 % |
| Partei | Kandidat | Stimmen | Anteil |
|---|---|---|---|
| Republikanische Partei | Horace A. Carter | 36.932 | 100 % |
| Sonstige | 16 | 0 % |
| Partei | Kandidat | Stimmen | Anteil |
|---|---|---|---|
| Republikanische Partei | Lewis R. Sullivan | 32.469 | 100 % |
| Sonstige | 7 | 0 % |
| Partei | Kandidat | Stimmen | Anteil |
|---|---|---|---|
| Republikanische Partei | George B. Wason | 31.602 | 100 % |
| Sonstige | 7 | 0 % |
| Partei | Kandidat | Stimmen | Anteil |
|---|---|---|---|
| Republikanische Partei | James F. Ingram Jr. | 35.339 | 85,6 % |
| Socialist Party | Lewis H. Spalding | 5.950 | 14,4 % |
| Sonstige | 2 | 0 % |
| Partei | Kandidat | Stimmen | Anteil |
|---|---|---|---|
| Republikanische Partei | James G. Harris | 36.397 | 100 % |
| Sonstige | 6 | 0 % |
| Partei | Kandidat | Stimmen | Anteil |
|---|---|---|---|
| Republikanische Partei | Matthew J. Whittall | 35.778 | 100 % |
| Sonstige | 7 |
| Partei | Kandidat | Stimmen | Anteil |
|---|---|---|---|
| Republikanische Partei | Henry L. Bowles | 39.193 | 100 % |
| Sonstige | 6 | 0 % |
US-Kongress
Senat
| ‹ 1913 • | |||||||||||
| Wahl eines US-Senators für Massachusetts | |||||||||||
| Senatorensitz der Klasse II | |||||||||||
| 5. November 1918 | |||||||||||
 |
Demokratische Partei | ||||||||||
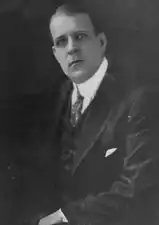
| David I. Walsh | |||||||||||
| Stimmen | 207.478 | ||||||||||
| 49,7 % | |||||||||||
 |
Republikanische Partei | ||||||||||
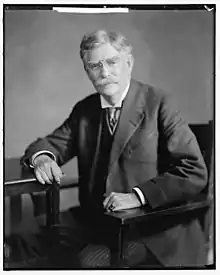
| John W. Weeks | |||||||||||
| Stimmen | 188.287 | ||||||||||
| 45,1 % | |||||||||||
 |
Unabhängiger | ||||||||||
| Thomas William Lawson | |||||||||||
| Stimmen | 21.985 | ||||||||||
| 5,3 % | |||||||||||
In der Wahl um den Klasse-2-Sitz von Massachusetts im US-Senat setzte sich der Demokrat David I. Walsh gegen den republikanischen Amtsinhaber John W. Weeks durch. Dabei wurde Walsh zum erst zweiten demokratischen US-Senator aus Massachusetts seit Robert Rantoul 1851, der sein Amt jedoch nur kommissarisch ausgeübt hatte.[7]
Repräsentantenhaus[8]
| District | Demokratische Partei | Republikanische Partei | Socialist Party | Unabhängige | Sonstige | |||||||||
|---|---|---|---|---|---|---|---|---|---|---|---|---|---|---|
| Kandidat | Stimmen | Anteil | Kandidat | Stimmen | Anteil | Kandidat | Stimmen | Anteil | Kandidat | Stimmen | Anteil | Stimmen | Anteil | |
| 1. District | Thomas F. Cassidy | 11.394 | 41,7 % | Allen T. Treadway | 15.933 | 58,3 % | ||||||||
| 2. District | Frederick H. Gillett | 20.277 | 99,9 % | 15 | 0,1 % | |||||||||
| 3. District | Eaton D. Sargent | 9.982 | 39,5 % | Calvin Paige | 15.267 | 60,5 % | ||||||||
| 4. District | John F. McGrath | 12.792 | 47,5 % | Samuel Winslow | 14.141 | 52,5 % | 2 | 0 % | ||||||
| 5. District | John Jacob Rogers | 20.496 | 99,2 % | 159 | 0,8 % | |||||||||
| 6. District | Wilfred W. Lufkin | 21.147 | 88,9 % | Estus E. James | 2.648 | 11,1 % | 4 | 0 % | ||||||
| 7. District | Michael F. Phelan | 14.437 | 57,3 % | Charles Cabot Johnson | 10.754 | 42,7 % | ||||||||
| 8. District | James F. Aylward | 11.093 | 39,7 % | Frederick W. Dallinger | 16.858 | 60,3 % | ||||||||
| 9. District | Henry C. Rowland | 8.022 | 31,3 % | Alvan T. Fuller | 17.597 | 68,7 % | ||||||||
| 10. District | John F. Fitzgerald | 7.241 | 47,3 % | Hammond T. Fletcher | 1.071 | 7,0 % | Peter F. Tague | 7.003 | 45,7 % | 1 | 0 % | |||
| 11. District | Francis J. Horgan | 10.529 | 43,6 % | George H. Tinkham | 13.644 | 56,4 % | 4 | 0 % | ||||||
| 12. District | James A. Gallivan | 18.349 | 70,4 % | Harrison A. Atwood | 7.709 | 29,6 % | 3 | 0 % | ||||||
| 13. District | Aloysius J. Doon | 12.538 | 40,7 % | Robert Luce | 18.257 | 59,3 % | 1 | 0 % | ||||||
| 14. District | Richard Olney | 18.009 | 56,6 % | Louis F. R. Langelier | 13.832 | 43,4 % | 1 | 0 % | ||||||
| 15. District | Arthur J. B. Cartier | 8.031 | 38,3 % | William S. Greene | 12.952 | 61,7 % | ||||||||
| 16. District | Frederic Tudor | 8.357 | 37,6 % | Joseph Walsh | 13.874 | 62,4 % | 2 | 0 % | ||||||
Senat von Massachusetts[9]
| Partei | Kandidat | Stimmen | Anteil |
|---|---|---|---|
| Republikanische Partei | Charles L. Gifford | 5.465 | 99,9 % |
| Sonstige | 6 | 0,1 % |
| Partei | Kandidat | Stimmen | Anteil |
|---|---|---|---|
| Republikanische Partei | Silas D. Reed | 7.004 | 87,6 % |
| Socialist Party | Hayden S. Stevens | 990 | 12,4 % |
| Partei | Kandidat | Stimmen | Anteil |
|---|---|---|---|
| Republikanische Partei | Walter E. McLane | 7.380 | 77,7 % |
| Unabhängiger | James Havican | 2.117 | 22,3 % |
| Partei | Kandidat | Stimmen | Anteil |
|---|---|---|---|
| Republikanische Partei | John Halliwell | 7.260 | 68,8 % |
| Demokratische Partei | William T. Dunn | 3.294 | 31,2 % |
| Partei | Kandidat | Stimmen | Anteil |
|---|---|---|---|
| Republikanische Partei | Edward N. Dahlborg | 6.057 | 54,5 % |
| Demokratische Partei | Ernest F. B. G. Davis | 4.460 | 40,1 % |
| Socialist Party | Zoel Thibadeau | 596 | 5,4 % |
| Partei | Kandidat | Stimmen | Anteil |
|---|---|---|---|
| Republikanische Partei | David S. McIntosh | 7.262 | 68,8 % |
| Demokratische Partei | Edward P. Boynton | 4.721 | 31,2 % |
| Partei | Kandidat | Stimmen | Anteil |
|---|---|---|---|
| Republikanische Partei | John A. Curtin | 8.067 | 100 % |
| Partei | Kandidat | Stimmen | Anteil |
|---|---|---|---|
| Republikanische Partei | Harold L. Perrin | 9.445 | 100 % |
| Sonstige | 2 | 0 % |
| Partei | Kandidat | Stimmen | Anteil |
|---|---|---|---|
| Republikanische Partei | John E. Beck | 5.474 | 56,7 % |
| Demokratische Partei | Thomas F. Rice | 4.185 | 43,3 % |
| Sonstige | 1 | 0 % |
| Partei | Kandidat | Stimmen | Anteil |
|---|---|---|---|
| Demokratische Partei | John J. Mahoney | 6.295 | 86,0 % |
| Republikanische Partei | Francesco Pastore | 1.022 | 14,0 % |
| Sonstige | 1 | 0 % |
| Partei | Kandidat | Stimmen | Anteil |
|---|---|---|---|
| Demokratische Partei | William J. Foley | 6.572 | 85,7 % |
| Republikanische Partei | Albert A. Stolp | 1.098 | 14,3 % |
| Partei | Kandidat | Stimmen | Anteil |
|---|---|---|---|
| Demokratische Partei | John J. Kearney | 5.312 | 80,5 % |
| Republikanische Partei | Charles E. Lord | 1.288 | 19,5 % |
| Sonstige | 1 | 0 % |
| Partei | Kandidat | Stimmen | Anteil |
|---|---|---|---|
| Republikanische Partei | Malcolm Nichols | 3.905 | 70,1 % |
| Demokratische Partei | John J. Purcell | 1.664 | 29,9 % |
| Partei | Kandidat | Stimmen | Anteil |
|---|---|---|---|
| Demokratische Partei | George E. Curran | 5.452 | 69,5 % |
| Republikanische Partei | Joseph Lundy | 2.141 | 27,3 % |
| Socialist Party | Louis E. Henderson | 255 | 3,2 % |
| Partei | Kandidat | Stimmen | Anteil |
|---|---|---|---|
| Demokratische Partei | Charles A. Winchester | 5.892 | 65,3 % |
| Republikanische Partei | Joseph H. Loring | 3.125 | 34,7 % |
| Partei | Kandidat | Stimmen | Anteil |
|---|---|---|---|
| Demokratische Partei | John Jackson Walsh | 5.124 | 51,5 % |
| Republikanische Partei | Simon Swig | 4.823 | 48,5 % |
| Sonstige | 1 | 0 % |
| Partei | Kandidat | Stimmen | Anteil |
|---|---|---|---|
| Republikanische Partei | Samuel B. Finkel | 4.741 | 55,1 % |
| Demokratische Partei | Timothy A. Burns | 3.851 | 44,8 % |
| Sonstige | 5 | 0,1 % |
| Partei | Kandidat | Stimmen | Anteil |
|---|---|---|---|
| Republikanische Partei | George H. Jackson | 5.992 | 59,6 % |
| Demokratische Partei | John R. Wallace | 4.063 | 40,4 % |
| Partei | Kandidat | Stimmen | Anteil |
|---|---|---|---|
| Republikanische Partei | August P. Loring | 6.368 | 64,1 % |
| Demokratische Partei | Robert C. Schneider | 3.559 | 35,9 % |
| Partei | Kandidat | Stimmen | Anteil |
|---|---|---|---|
| Republikanische Partei | Charles D. Brown | 6.185 | 100 % |
| Sonstige | 2 | 0 % |
County Government
County Treasurer[10]
| County | Demokratische Partei | Republikanische Partei | Socialist Party | Unabhängiger | Sonstige | |||||||||
|---|---|---|---|---|---|---|---|---|---|---|---|---|---|---|
| Kandidat | Stimmen | Anteil | Kandidat | Stimmen | Anteil | Kandidat | Stimmen | Anteil | Kandidat | Stimmen | Anteil | Stimmen | Anteil | |
| Barnstable | Edward L. Chase | 3.460 | 100 % | |||||||||||
| Berkshire | Samuel B. Rothkopf | 5.762 | 35,5 % | Henry A. Brewster | 10.469 | 64,5 % | ||||||||
| Bristol | Edgar L. Crossman | 27.163 | 100 % | 6 | 0 % | |||||||||
| Dukes | Herbert N. Hinckley | 711 | 100 % | |||||||||||
| Essex | David I. Robinson | 42.294 | 86,2 % | Edward J. Hoar | 6.744 | 13,8 % | 7 | 0 % | ||||||
| Franklin | Eugene A. Newcomb | 4.149 | 85,7 % | Charles E. Keller | 694 | 14,3 % | ||||||||
| Hampden | Fred A. Bearse | 25.234 | 91,7 % | George Day | 2.289 | 8,3 % | ||||||||
| Hampshire | Edwin H. Banister | 7.513 | 100 % | 1 | 0 % | |||||||||
| Middlesex | David A. Keefe | 34.396 | 36,1 % | Joseph O. Hayden | 56.950 | 59,8 % | De Witt Clinton Clapp | 3.829 | 4,0 % | |||||
| Norfolk | Henry D. Humphrey | 21.064 | 100 % | 5 | 0 % | |||||||||
| Plymouth | Horace T. Fogg | 15.154 | 83,5 % | Henry W. Patterson | 2.982 | 16,5 % | 2 | 0 % | ||||||
| Worcester | Edgar L. Ramsdell | 38.148 | 100 % | 5 | 0 % | |||||||||
County Commissioner
In allen der 14 Countys bis auf Suffolk und Nantucket wurde einer der drei County Commissioner gewählt. Die Republikaner konnten sich in allen Countys durchsetzen.[11] Die County Commissions waren damals Exekutive und Legislative der jeweiligen Countys zugleich.
| Partei | Kandidat | Stimmen | Anteil |
|---|---|---|---|
| Republikanische Partei | Benjamin F. Bourne | 3.437 | 99,9 % |
| Sonstige | 3 | 0,1 % |
| Partei | Kandidat | Stimmen | Anteil |
|---|---|---|---|
| Republikanische Partei | John H. C. Church | 11.617 | 99,9 % |
| Sonstige | 13 | 0,1 % |
| Partei | Kandidat | Stimmen | Anteil |
|---|---|---|---|
| Republikanische Partei | John I. Bryant | 22.808 | 64,2 % |
| Demokratische Partei | William H. Gifford III | 12.722 | 35,8 % |
| Sonstige | 2 | 0 % |
| Partei | Kandidat | Stimmen | Anteil |
|---|---|---|---|
| Republikanische Partei | Frederick W. Smith | 456 | 57,9 % |
| Unabhängiger | Archibald Mellen | 331 | 42,1 % |
| Partei | Kandidat | Stimmen | Anteil |
|---|---|---|---|
| Republikanische Partei | James C. Poor | 36.622 | 61,0 % |
| Demokratische Partei | Fred O. Spaulding | 20.312 | 33,8 % |
| Socialist Party | Joseph A. Wallis II | 3.119 | 5,2 % |
| Sonstige | 7 | 0 % |
| Partei | Kandidat | Stimmen | Anteil |
|---|---|---|---|
| Republikanische Partei | William B. Avery | 5.126 | 86,6 % |
| Socialist Party | Frank E. Whitcomb | 793 | 13,4 % |
| Partei | Kandidat | Stimmen | Anteil |
|---|---|---|---|
| Republikanische Partei | Charles C. Spellman | 16.987 | 55,5 % |
| Demokratische Partei | John J. Collins | 12.226 | 40,0 % |
| Socialist Party | John Hall Jr. | 1.369 | 4,5 % |
| Partei | Kandidat | Stimmen | Anteil |
|---|---|---|---|
| Republikanische Partei | N. Seelye Hitchcock | 5.982 | 61,4 % |
| Demokratische Partei | Matthew J. Ryan | 3.753 | 38,5 % |
| Sonstige | 2 | 0 % |
| Partei | Kandidat | Stimmen | Anteil |
|---|---|---|---|
| Republikanische Partei | Alfred L. Cutting | 59.666 | 59,7 % |
| Demokratische Partei | Michael M. O’Connor | 33.227 | 33,2 % |
| Demokratische Partei | William H. Walsh | 4.686 | 4,7 % |
| Republikanische Partei | John Lathrop Dyer | 2.428 | 2,4 % |
| Sonstige | 1 | 0 % |
| Partei | Kandidat | Stimmen | Anteil |
|---|---|---|---|
| Republikanische Partei | Evan F. Richardson | 21.075 | 98,6 % |
| Unabhängiger | Jeremiah O’Leary | 228 | 1,1 % |
| Unabhängiger | Addison E. Bullhard | 61 | 0,3 % |
| Sonstige | 5 | 0 % |
| Partei | Kandidat | Stimmen | Anteil |
|---|---|---|---|
| Republikanische Partei | Frederic T. Bailey | 12.880 | 58,7 % |
| Demokratische Partei | Harold F. Studley | 6.866 | 31,3 % |
| Socialist Party | Elmer A. Wright | 1.256 | 5,7 % |
| Progressive Party | Daniel E. Damon | 943 | 4,3 % |
| Partei | Kandidat | Stimmen | Anteil |
|---|---|---|---|
| Republikanische Partei | Arthur C. Moore | 34.086 | 66,7 % |
| Demokratische Partei | James F. Power | 17.032 | 33,3 % |
Einzelnachweise
- Election Statistics. Office of the Secretary of the Commonwealth, Boston 1919, S. 122–128.
- Election Statistics. Office of the Secretary of the Commonwealth, Boston 1919, S. 6–12.
- Election Statistics. Office of the Secretary of the Commonwealth, Boston 1919, S. V.
- Election Statistics. Office of the Secretary of the Commonwealth, Boston 1919, S. VI.
- Governor’s Council. In: mass.gov. Abgerufen am 17. Februar 2022 (englisch).
- Election Statistics. Office of the Secretary of the Commonwealth, Boston 1919, S. 306–310.
- Election Statistics. Office of the Secretary of the Commonwealth, Boston 1919, S. 299.
- Election Statistics. Office of the Secretary of the Commonwealth, Boston 1919, S. 300–304.
- Election Statistics. Office of the Secretary of the Commonwealth, Boston 1919, S. 311–315.
- Election Statistics. Office of the Secretary of the Commonwealth, Boston 1919, S. 368–373.
- Election Statistics. Office of the Secretary of the Commonwealth, Boston 1919, S. 361–367.