North Tyneside (Wahlkreis)
North Tyneside ist ein Wahlkreis für das britische Unterhaus. Der Wahlkreis wurde zur Unterhauswahl 1997 geschaffen. Er entsendet einen Abgeordneten ins Parlament.
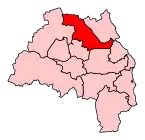
Der Wahlkreis North Tyneside
Grenzen
- 1997–2010: Metropolitan Borough of North Tyneside mit den Wards Battle Hill, Benton, Camperdown, Holystone, Howdon, Longbenton, Riverside, Valley, and Weetslade.
- seit 2010: Metropolitan Borough of North Tyneside mit den Wards Battle Hill, Benton, Camperdown, Howdon, Killingworth, Longbenton, Northumberland, Riverside, Wallsend, and Weetslade.
Der Ward Wallsend war zuvor Teil des Wahlkreises Newcastle upon Tyne East and Wallsend, welcher in Folge der Änderungen im Jahr 2010 zum Wahlkreis Newcastle upon Tyne East geworden ist.
Abgeordnete
| Wahl | Abgeordneter | Partei |
|---|---|---|
| 1997 | Stephen Byers | Labour |
| 2010 | Mary Glindon | Labour |
Wahlergebnisse
| Unterhauswahl 2017: North Tyneside[1] | ||||
|---|---|---|---|---|
| Partei | Kandidat | Stimmen | % | ± |
| Labour | Mary Glindon | 33.456 | 64,5 | +8,5 |
| Conservative | Henry Newman | 14.172 | 27,3 | +8,1 |
| UKIP | Gary Legg | 2.101 | 4,0 | −12,2 |
| Liberal Democrats | Greg Stone | 1.494 | 2,9 | −1,6 |
| Green | Martin Collins | 669 | 1,3 | −1,8 |
| Wahlbeteiligung | 51.892 | 65,7 | +6,7 | |
| Unterhauswahl 2015: North Tyneside[2] | ||||
|---|---|---|---|---|
| Partei | Kandidat | Stimmen | % | ± |
| Labour | Mary Glindon | 26.191 | 55,9 | +5,3 |
| Conservative | Martin McGann | 8.997 | 19,2 | +0,9 |
| UKIP | Bridget Fox | 7.618 | 16,3 | +13,5 |
| Liberal Democrats | John Appleby | 2.075 | 4,4 | −18,5 |
| Green | Martin Collins | 1.442 | 3,1 | +3,1 |
| Trade Unionist and Socialist Coalition | Tim Wall | 304 | 0,6 | |
| National Front | Bob Batten | 191 | 0,4 | −0,9 |
| Wahlbeteiligung | 46.818 | 59,0 | −0,7 | |
| Unterhauswahl 2010: North Tyneside[3] | ||||
|---|---|---|---|---|
| Partei | Kandidat | Stimmen | % | ± |
| Labour | Mary Glindon | 23.505 | 55,9 | +5,3 |
| Liberal Democrats | David Ord | 10.621 | 22,9 | +0,9 |
| Conservative | Gagan Mohindra | 8.514 | 18,3 | −0,3 |
| BNP | John Burrows | 1.860 | 4,0 | |
| UKIP | Claudia Blake | 1.306 | 2,8 | |
| National Front | Bob Batten | 599 | 1,3 | |
| Wahlbeteiligung | 46.405 | 59,7 | +4,3 | |
| Unterhauswahl 2005: North Tyneside[4] | ||||
|---|---|---|---|---|
| Partei | Kandidat | Stimmen | % | ± |
| Labour | Stephen Byers | 22.882 | 61,9 | −7,6 |
| Conservative | Duncan McLellan | 7.845 | 21,2 | +6,6 |
| Liberal Democrats | Gillian Ferguson | 6.212 | 16,8 | +4,4 |
| Wahlbeteiligung | 36.939 | 57,2 | −0,5 | |
| Unterhauswahl 2001: North Tyneside[5] | ||||
|---|---|---|---|---|
| Partei | Kandidat | Stimmen | % | ± |
| Labour | Stephen Byers | 26.027 | 69,5 | −3,3 |
| Conservative | Mark Ruffell | 5.459 | 14,6 | +0,9 |
| Liberal Democrats | Simon Reed | 4.649 | 12,4 | +1,9 |
| UKIP | Alan Taylor | 770 | 2,1 | |
| Socialist Alliance | Pete Burnett | 324 | 0,9 | |
| Socialist Labour | Kenneth Capstick | 240 | 0,6 | |
| Wahlbeteiligung | 37.469 | 57,7 | −10,2 | |
| Unterhauswahl 1997: North Tyneside[6] | ||||
|---|---|---|---|---|
| Partei | Kandidat | Stimmen | % | ± |
| Labour | Stephen Byers | 32.810 | 72,7 | |
| Conservative | Michael McIntyre | 6.167 | 13,7 | |
| Liberal Democrats | Tommy Mulvenna | 4.762 | 10,6 | |
| Referendum Party | Michael Rollings | 1.382 | 3,1 | |
| Wahlbeteiligung | 45.119 | 67,9 | ||
Einzelnachweise
- General Election 2017 – Results. BBC, abgerufen am 25. August 2017.
- UK General Election results May 2015. Abgerufen am 25. August 2017.
- Election 2010 – Constituency – Tyneside North. Abgerufen am 25. August 2017.
- Election 2005 – Results – Tyneside North. BBC, abgerufen am 25. August 2017.
- Vote 2001 – Results & Constituencies – Tyneside North. BBC, abgerufen am 25. August 2017.
- Tyneside North – Archive. Abgerufen am 25. August 2017.
This article is issued from Wikipedia. The text is licensed under Creative Commons - Attribution - Sharealike. The authors of the article are listed here. Additional terms may apply for the media files, click on images to show image meta data.